January 5, 2023
Cattle Finishing Net Returns Prospects for 2023
By Michael Langemeier
![]()
![]()
![]()
![]()
![]()
Due to relatively strong fed cattle prices, cattle finishing net returns ended 2022 on a more positive note. Given this, what are prospects for net returns in 2023? This article examines feeding cost of gain, breakeven prices, and net return estimates for 2022, and provides projections for the first half of 2023. Several data sources were used to compute net returns. Average daily gain, feed conversion, days on feed, in weight, out weight, and feeding cost of gain were obtained from monthly issues of the Focus on Feedlots newsletter. Futures prices for corn and seasonal feed conversion rates were used to project feeding cost of gain for the next several months. Net returns were computed using feeding cost of gain from monthly issues of the Focus on Feedlots newsletter, fed cattle prices and feeder cattle prices reported by the Livestock Marketing Information Center (LMIC), and interest rates from the Federal Reserve Bank of Kansas City.
Feeding Cost of Gain
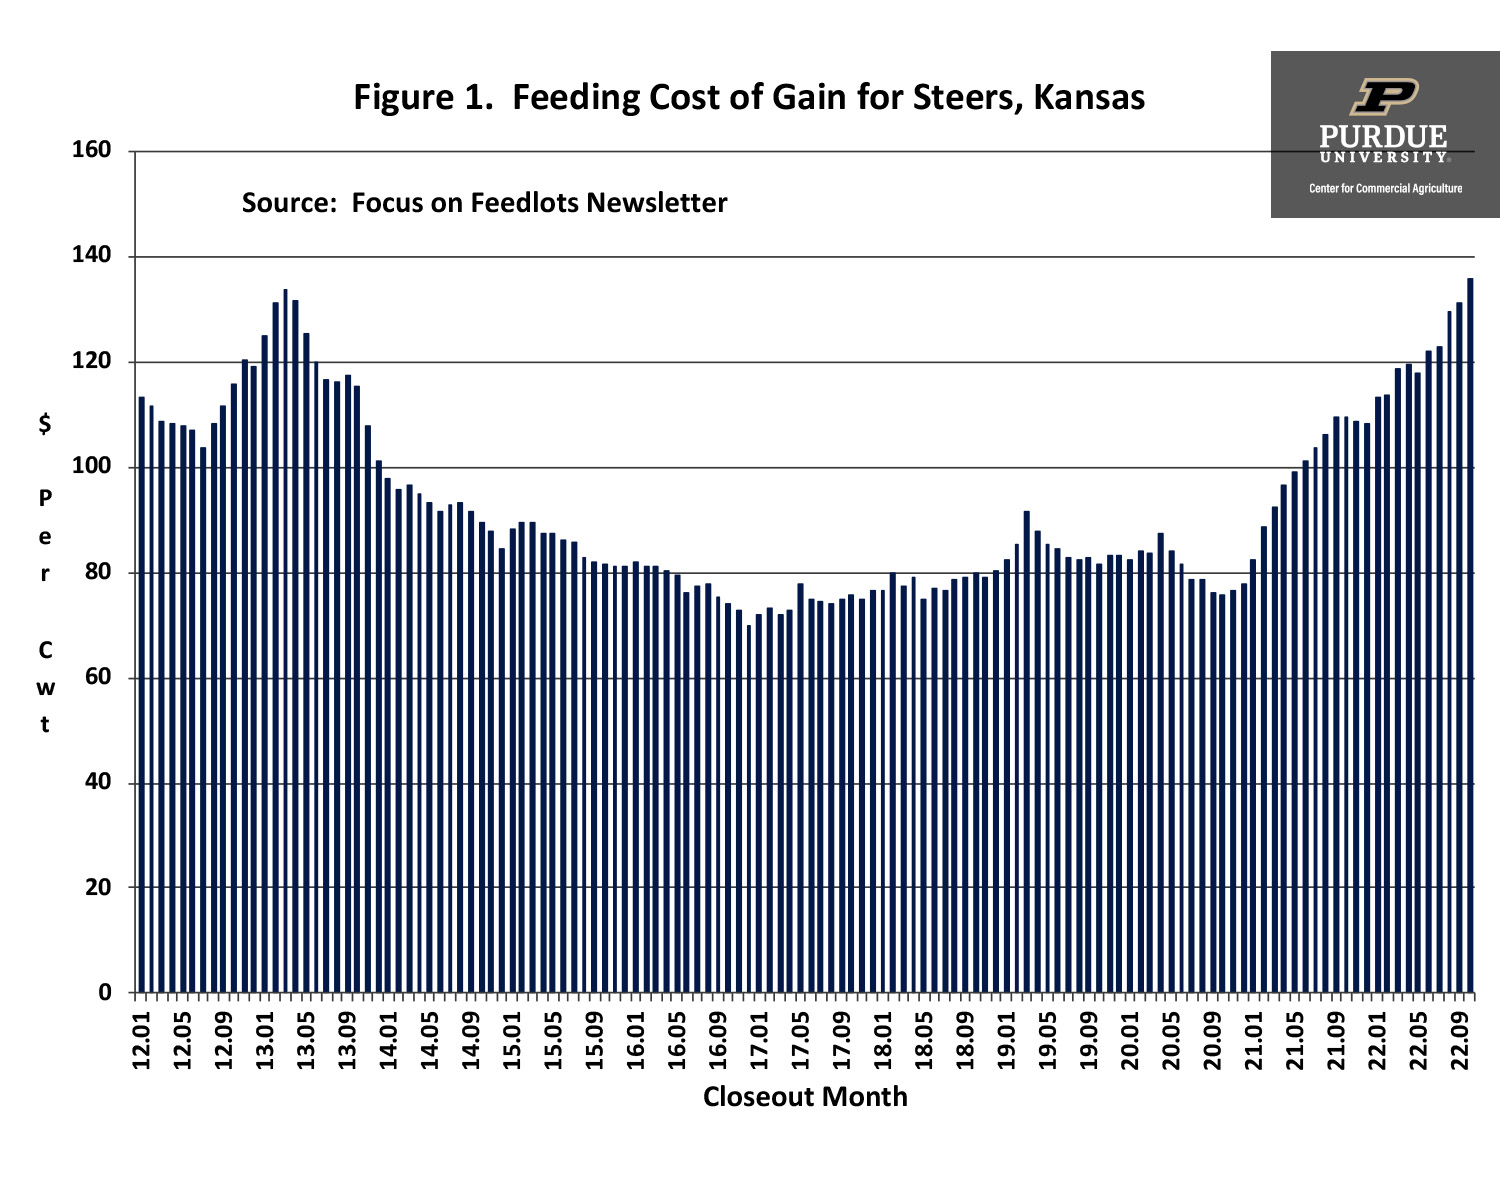
Figure 1. Feeding Cost of Gain for Steers, Kansas
Figure 1 illustrates monthly feeding cost of gain from January 2012 to October 2022. Feeding cost of gain in October, the latest month for which data were available, was $135.92. This value exceeded the relatively high cost of gains experienced in early 2013. A natural question to ask is whether the October value represents a peak. The short answer is probably not. One of the ways to answer the question is to note that the projected cost of gain for cattle placed in October using the survey results presented in the Focus on Feedlot newsletter was $146.20. Another way to answer the question is to project feeding cost of gain for the next several months and see how these values compare to feeding cost of gain for October. Given the uncertainty in corn and alfalfa prices, this is not an easy task. Nevertheless, here goes. Feeding cost of gain for November and December of 2022 is expected to range from $137 to $140. Using the mid-point of these projections, the estimated feeding cost of gain for 2022 is $127.50. Feeding cost of gain for the first and second quarters of 2023 are expected to range from $140 to $143 and from $135 to $140, respectively.
Feeding cost of gain is sensitive to changes in feed conversions, corn prices, and alfalfa prices. Regression analysis was used to examine the relationship between feeding cost of gain, and feed conversion, corn prices, and alfalfa prices. Results are as follows: each 0.10 increase in feed conversion increases feeding cost of gain by $1.10 per cwt., each $0.10 per bushel increase in corn prices increases feeding cost of gain by $0.86 per cwt., and each $5 per ton increase in alfalfa prices increases feeding cost of gain by $0.59 per cwt.
Feeder to Fed Cattle Price Ratio
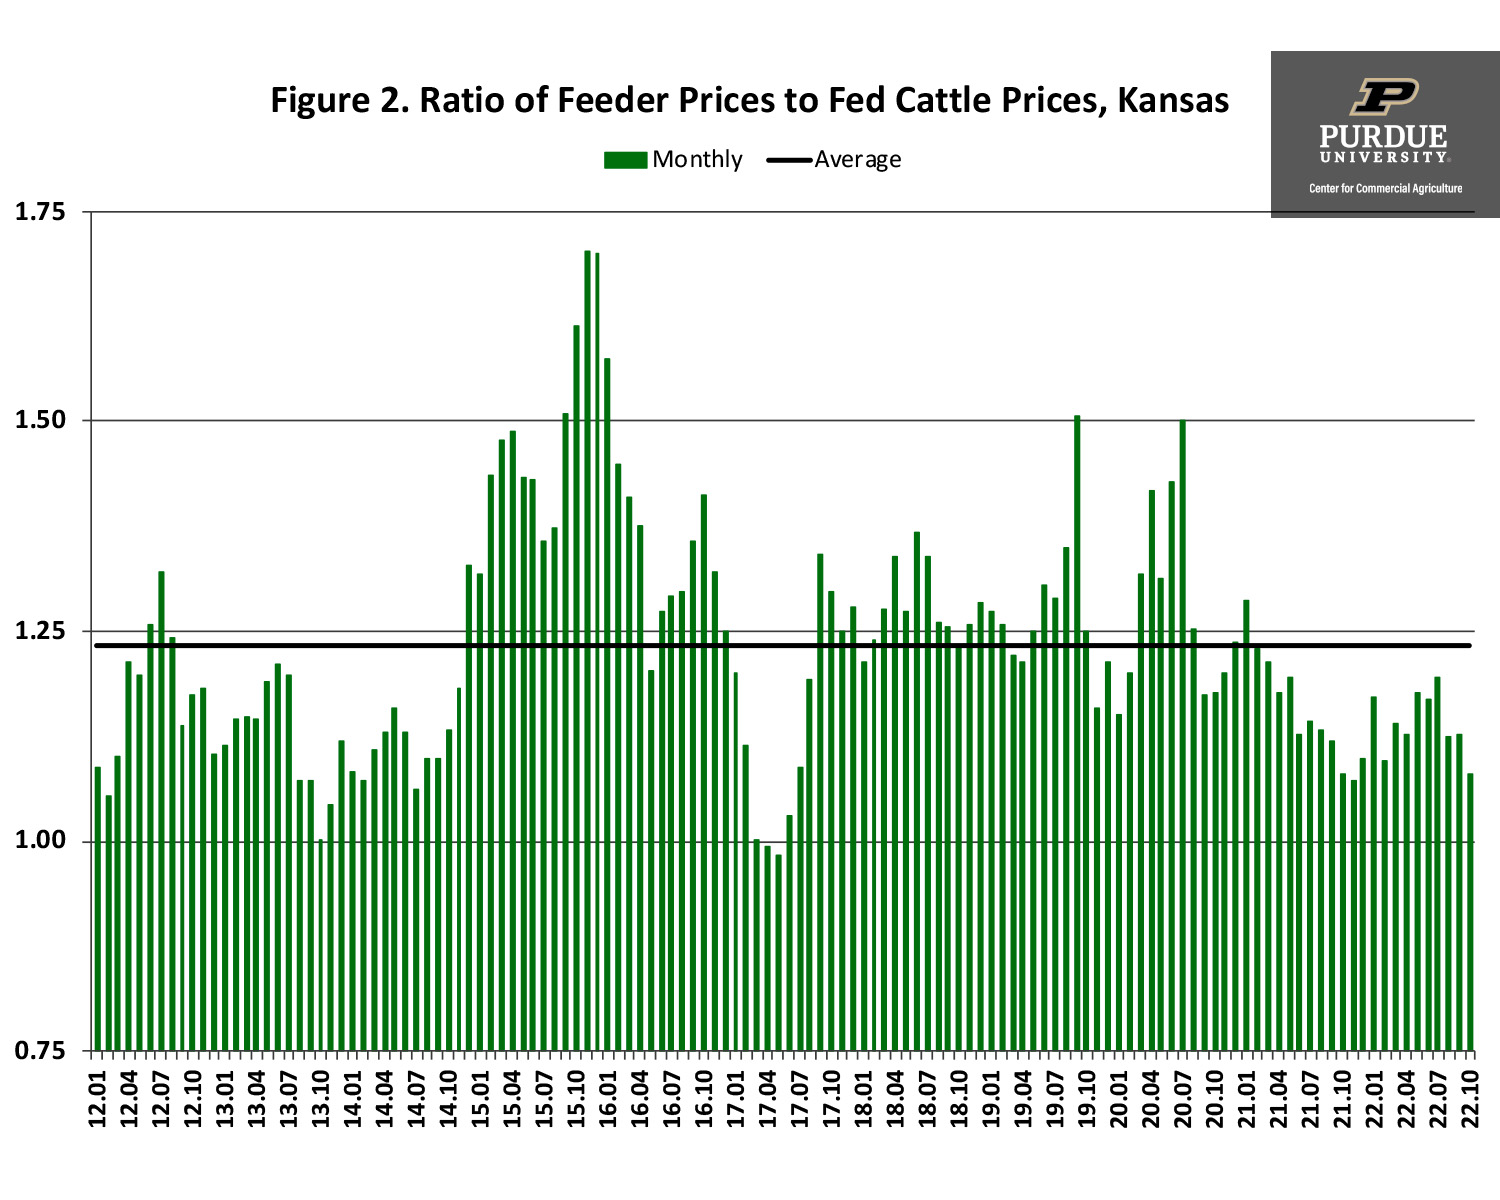
Figure 2. Ratio of Feeder Prices to Fed Cattle Prices, Kansas
The ratio of feeder to fed cattle prices since January 2012 is illustrated in figure 2. Since January 2012, this ratio averaged 1.23. The feeder to fed cattle price ratio was one standard deviation below (above) the average for 17 (18) months since January 2012. The average net return for the months in which the ratio was below one standard deviation of the average was $108 per head. In contrast, the average loss for the months in which the ratio was above one standard deviation was $265 per head. The average ratio for the 18 the months with a feeder to fed cattle price ratio that was above one standard deviation of the long-run average was 1.49. Due to the detrimental impact of relatively high corn prices on feeder cattle prices, the feeder to fed cattle rate was relatively low in 2022. In fact, the ratio averaged only 1.08 in the fourth quarter. Typically, when the feeder to fed cattle price is low, the cattle finishing sector experiences strong net returns. The high feeding cost of gain experienced in the second half of 2022 prevented this from happening. Projected net return for the fourth quarter is a negative $40 per head.
Looking ahead, the feeder to fed cattle price ratio is expected to remain below the long-run average for the first half of 2023. Specifically, the ratio is expected to range from 1.15 to 1.20 during the first half of 2023.
Net Return Prospects
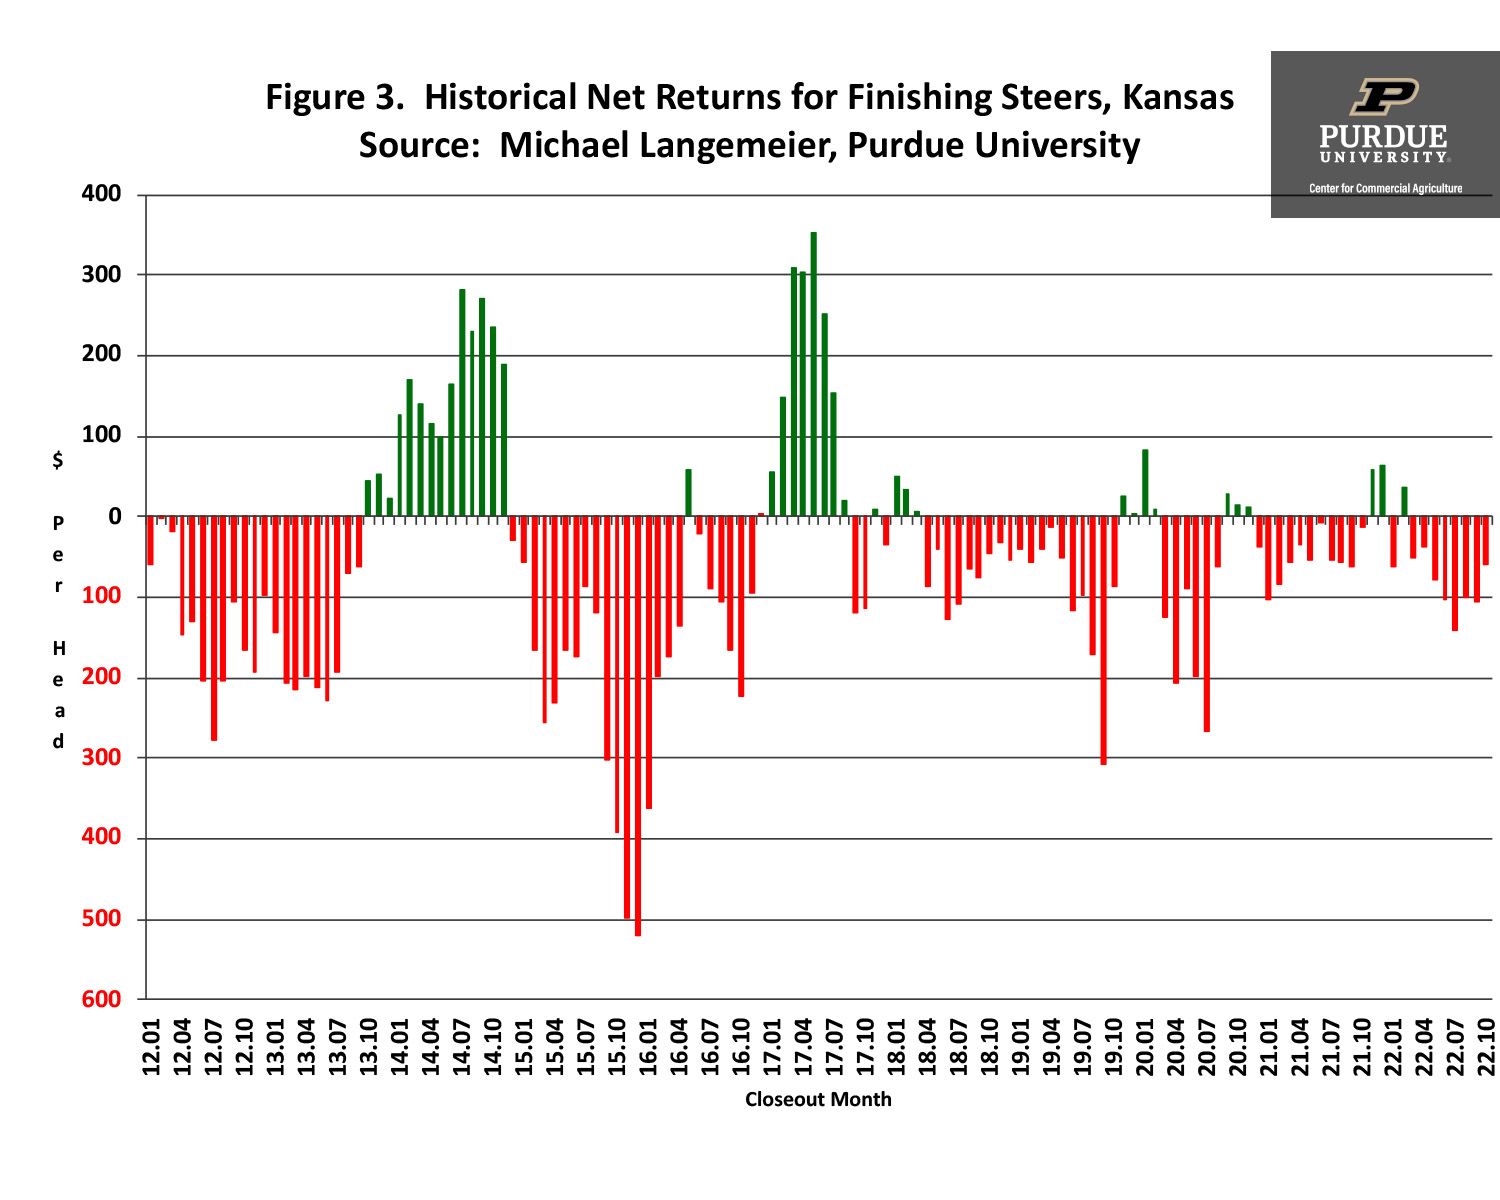
Figure 3. Historical Net Returns for Finishing Steers, Kansas
Monthly steer finishing net returns from January 2012 to October 2022 are presented in Figure 3. It is important to note that net returns were computed using closeout months rather than placement months. The average net loss for 2022 is expected to be approximately $70 per head with the smallest losses occurring in the first and fourth quarters and larger losses experienced in the second and third quarters. As indicated above, the feeder to fed cattle price ratio was relatively low during 2022, thus cattle finishing losses were largely due to high cost of gains. Rather than focus on net return projections, we will provide expected breakeven prices below. Of course, these breakeven prices incorporate expected feeder to fed cattle price ratios as well as cost of gain projections.
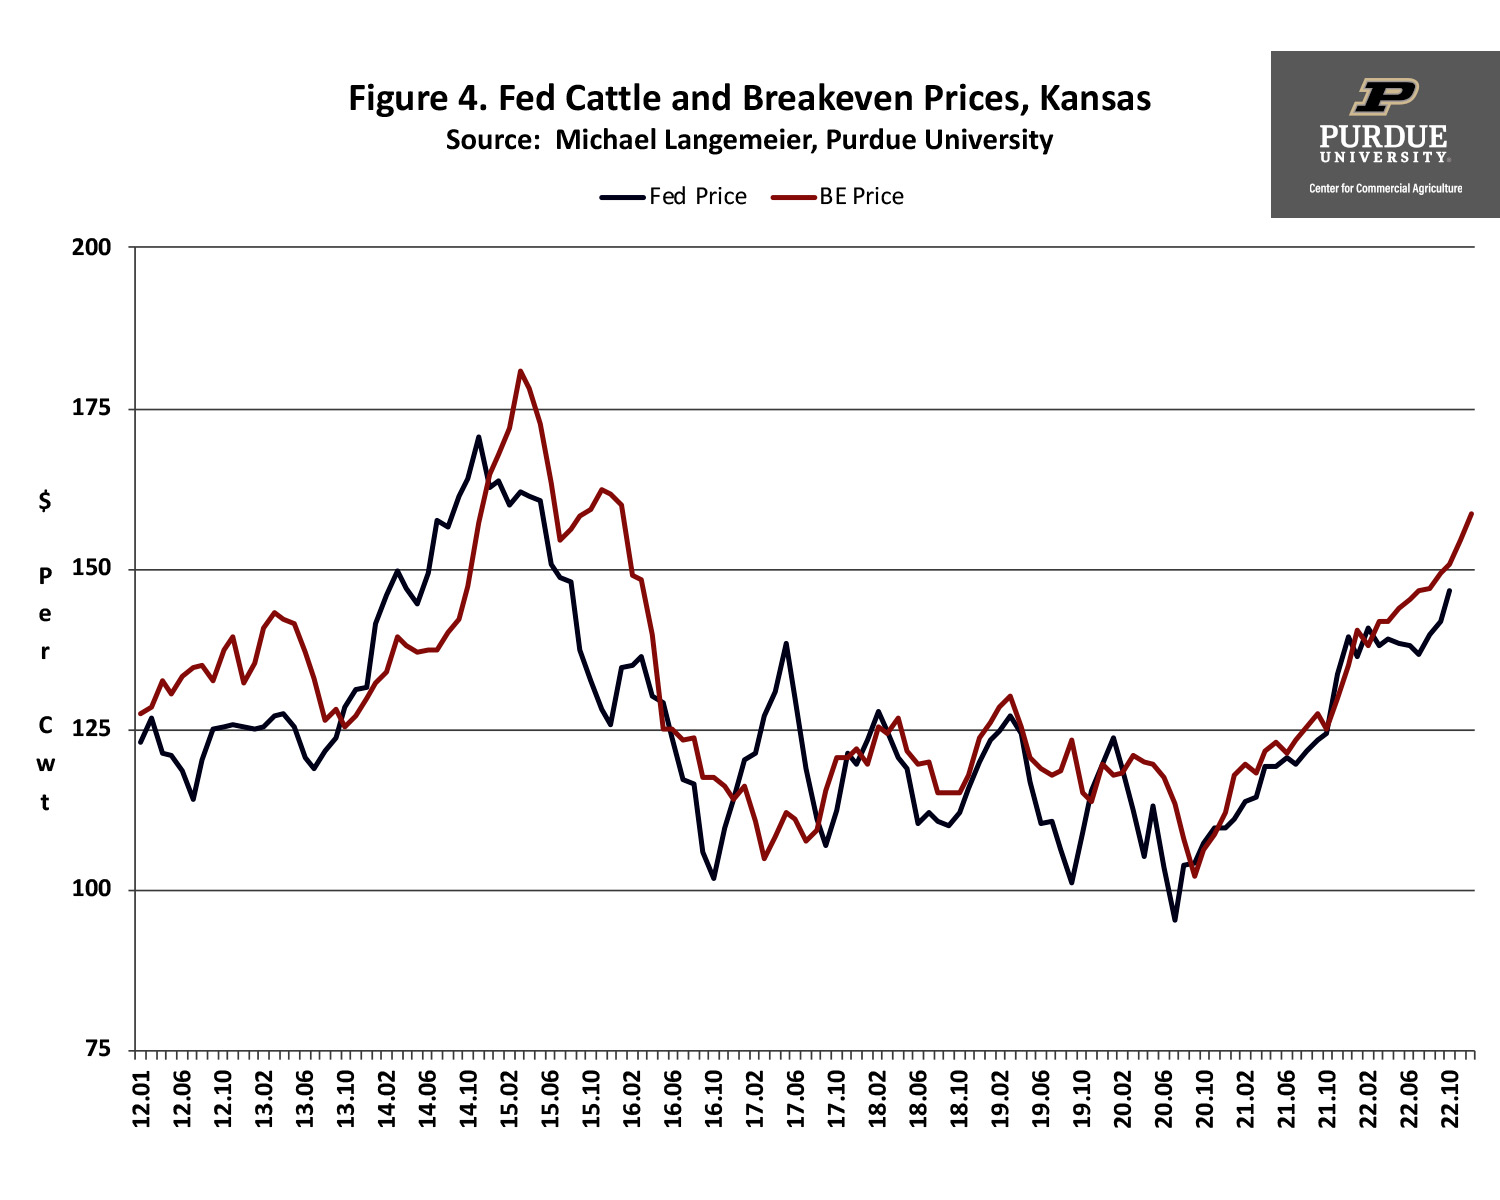
Figure 4. Fed Cattle and Breakeven Prices, Kansas
Historical and breakeven prices for the last ten years, as well as projected breakeven prices through the December of 2022, are illustrated in figure 4. The average breakeven price for 2022 was approximately $149. The breakeven price in the fourth quarter of 2022 was approximately $155. Breakeven prices for the first and second quarters of 2023 are expected to range from $162 to $165 per cwt. Combining these breakeven prices with Livestock Marketing Information Center (LMIC) fed cattle price projections results in expected losses in the first and second quarters of 2023. Due to the amount uncertainty related to the current market environment, our typical caveats apply to these projections. Net return prospects could change rapidly.
Conclusions
This article discussed recent trends in feeding cost of gain, the feeder to fed cattle price ratio, breakeven prices, and cattle finishing net returns. Average cattle finishing losses in 2022 were estimated to be approximately $70 per head. Current breakeven and fed cattle price projections suggest that the cattle finishing sector will experience net losses in the first half of 2023.
Citations
Focus on Feedlots, Animal Sciences and Industry, Kansas State University, www.asi.k-state.edu/about/newsletters/focus-on-feedlots , accessed January 3, 2023.
Livestock Marketing Information Center, www.lmic.info/, accessed January 3, 2023.
![]()
![]()
![]()
![]()
![]()
TAGS:
TEAM LINKS:

RELATED RESOURCES
UPCOMING EVENTS
We are taking a short break, but please plan to join us at one of our future programs that is a little farther in the future.