


July 10, 2023
Benchmarking Crop Machinery Cost and Investment
by Michael Langemeier
![]()
![]()
![]()
![]()
![]()
The continued increase in size of tractors, combines, and other machinery has enabled farms to operate more acres and reduce labor use per acre. However, this increase in machinery size also makes it increasingly important to evaluate the efficient use of machinery. This article will discuss machinery cost and investment benchmarks, and illustrate the computation of crop machinery cost and investment for a case farm in west central Indiana.
Key Machinery Benchmarks
Crop machinery cost per acre is computed by summing depreciation, interest, property taxes, insurance, leasing, repairs, fuel and lubricants, and custom hire and rental expense; and dividing the resulting figure by crop acres or harvested acres. Interest should include both cash interest paid and an opportunity charge on machinery and equipment that is owned. In regions where double-cropping predominates, using harvested acres is preferable.
Crop machinery investment per acre is computed by dividing total crop machinery investment (i.e., investment in tractors, combines, and other machinery) by crop acres or harvested acres. Again, in regions where double-cropping is prevalent, using harvested acres gives a more accurate depiction of machinery investment.
Machinery investment per acre typically declines with farm size. Thus, it is important for farms to compare machinery investment per acre with similarly sized farms and to examine the trend in this benchmark for a particular farm. A farm with relatively high machinery investment per acre needs to determine whether this high value is a problem. If the farm faces serious labor or timeliness constraints, their machinery investment per acre may be relatively high. However, if their machinery investment per acre is high due to the purchase of assets used to mitigate income tax obligations or for some other reason, the farm needs to think about their long-term strategy with respect to purchasing machinery and equipment.
Case Farm Illustration
Crop machinery cost and investment per acre for a case farm in west central Indiana is presented in table 1. This case farm has 1500 acres of full-season corn and 1500 acres of full-season soybeans. If this farm had livestock, the relevant machinery cost and investment figures for the livestock operation would need to be excluded from total machinery cost and investment to compute the values in table 1. Machinery costs include depreciation, interest, insurance, repairs, and fuel and lubricant. This farm does not custom hire or lease machinery so the values for these items are zero in table 1. Interest was computed using information pertaining to the farm’s term loan for machinery. Though it is often preferably to include opportunity interest cost in the computation of crop machinery cost, using the actual interest expense is more comparable to the benchmarks discussed below. In summary, the crop machinery cost per acre for the case farm was $130.
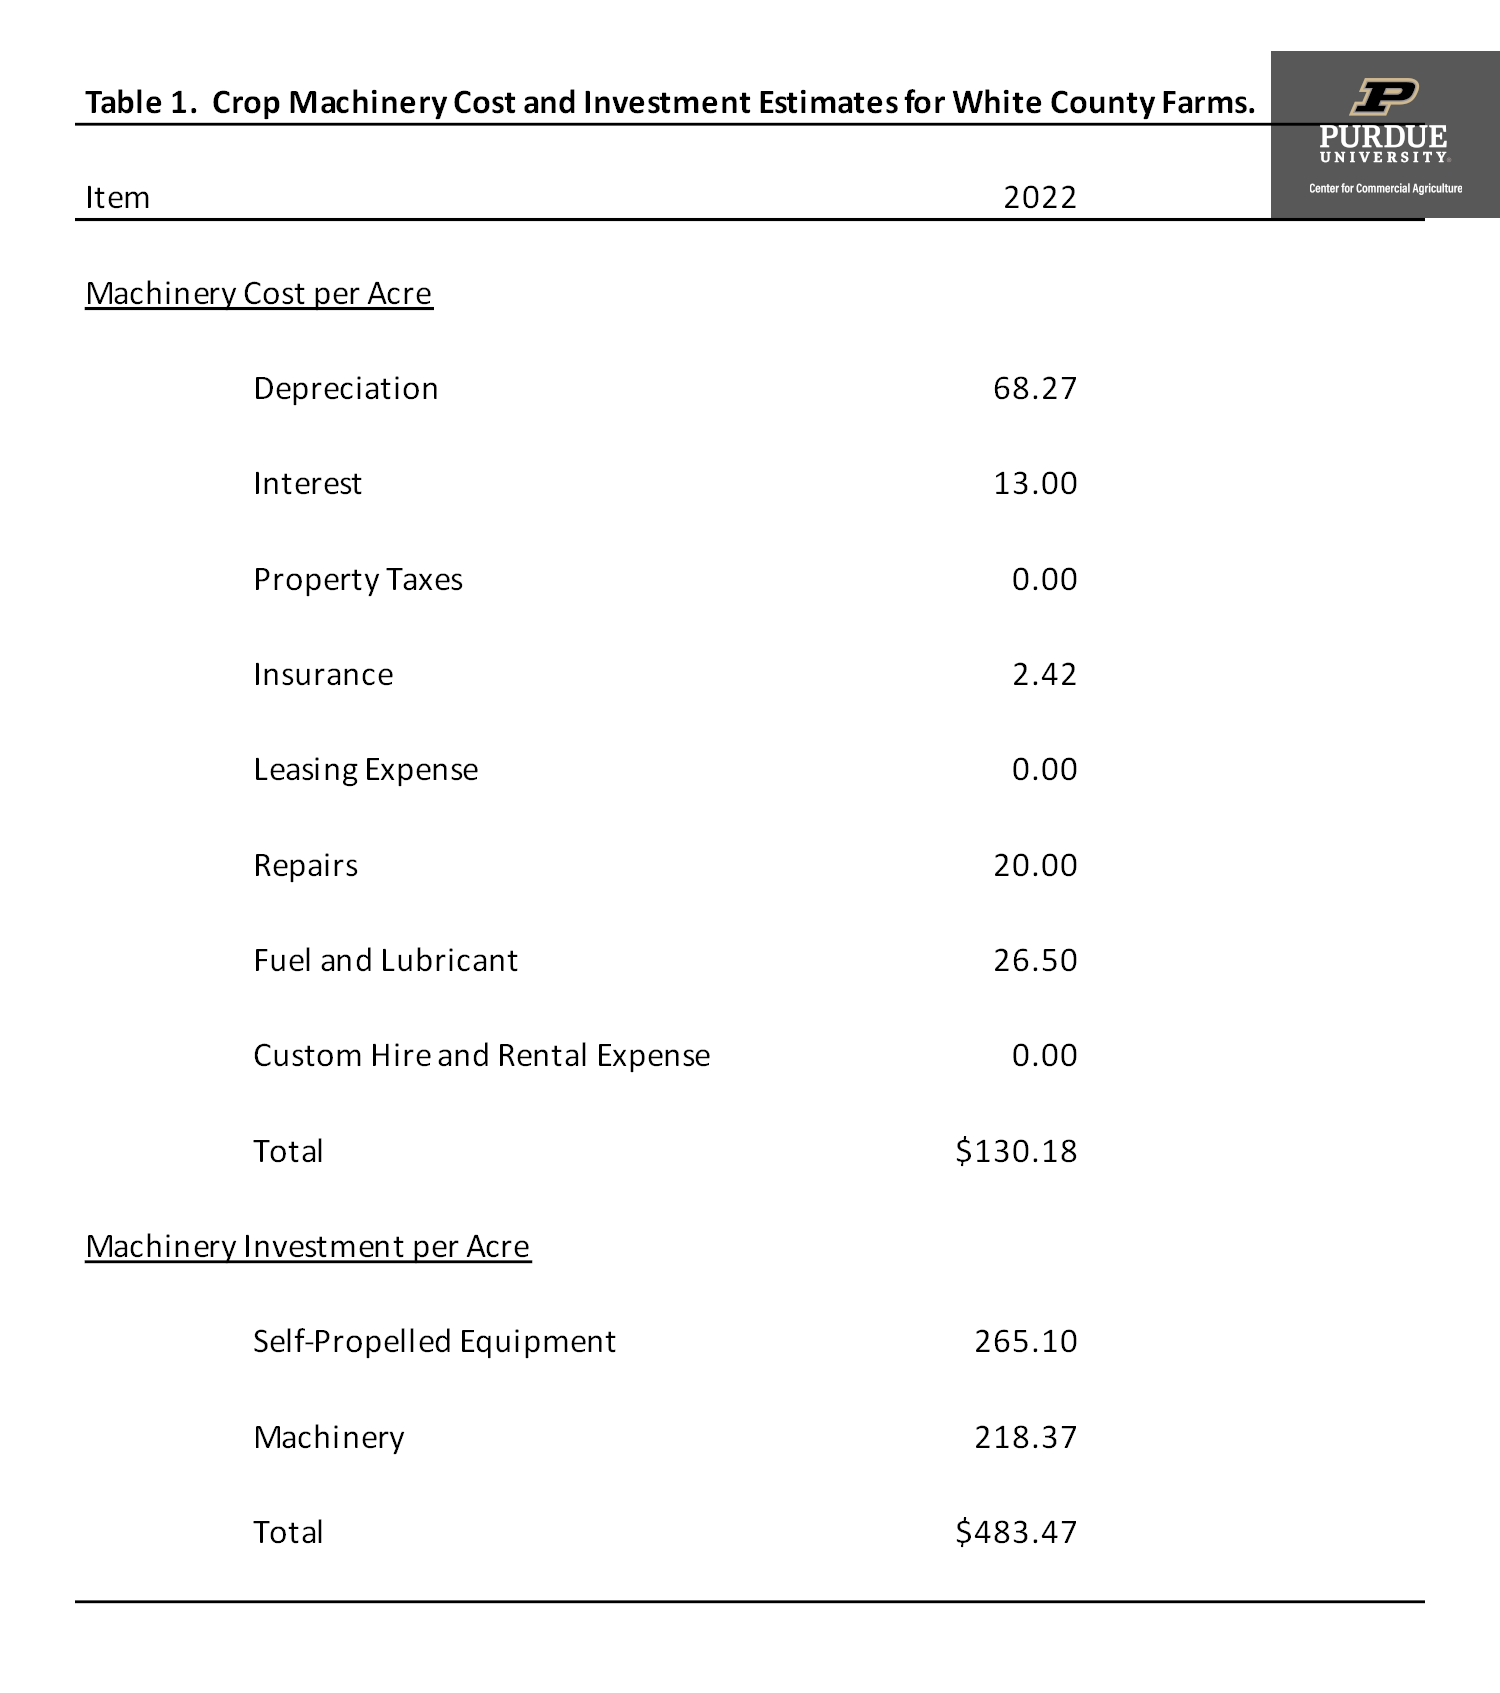
Table 1. Crop Machinery Cost and Investment Estimates for White County Farms.
Using the Center for Farm Financial Management’s FINBIN database, figure 1 illustrates the trend in machinery cost per acre from 2013 to 2022 for farms with corn or soybeans. Specifically, the chart illustrates crop machinery cost for corn, soybeans, and the average for the two crops. Discussion will focus on the average for the two crops. Average crop machinery cost per acre increased approximately 21 percent from 2021 to 2022. In 2022, the average machinery cost per acre for the two crops was $148. In comparison, the machinery cost for the case farm is relatively low.
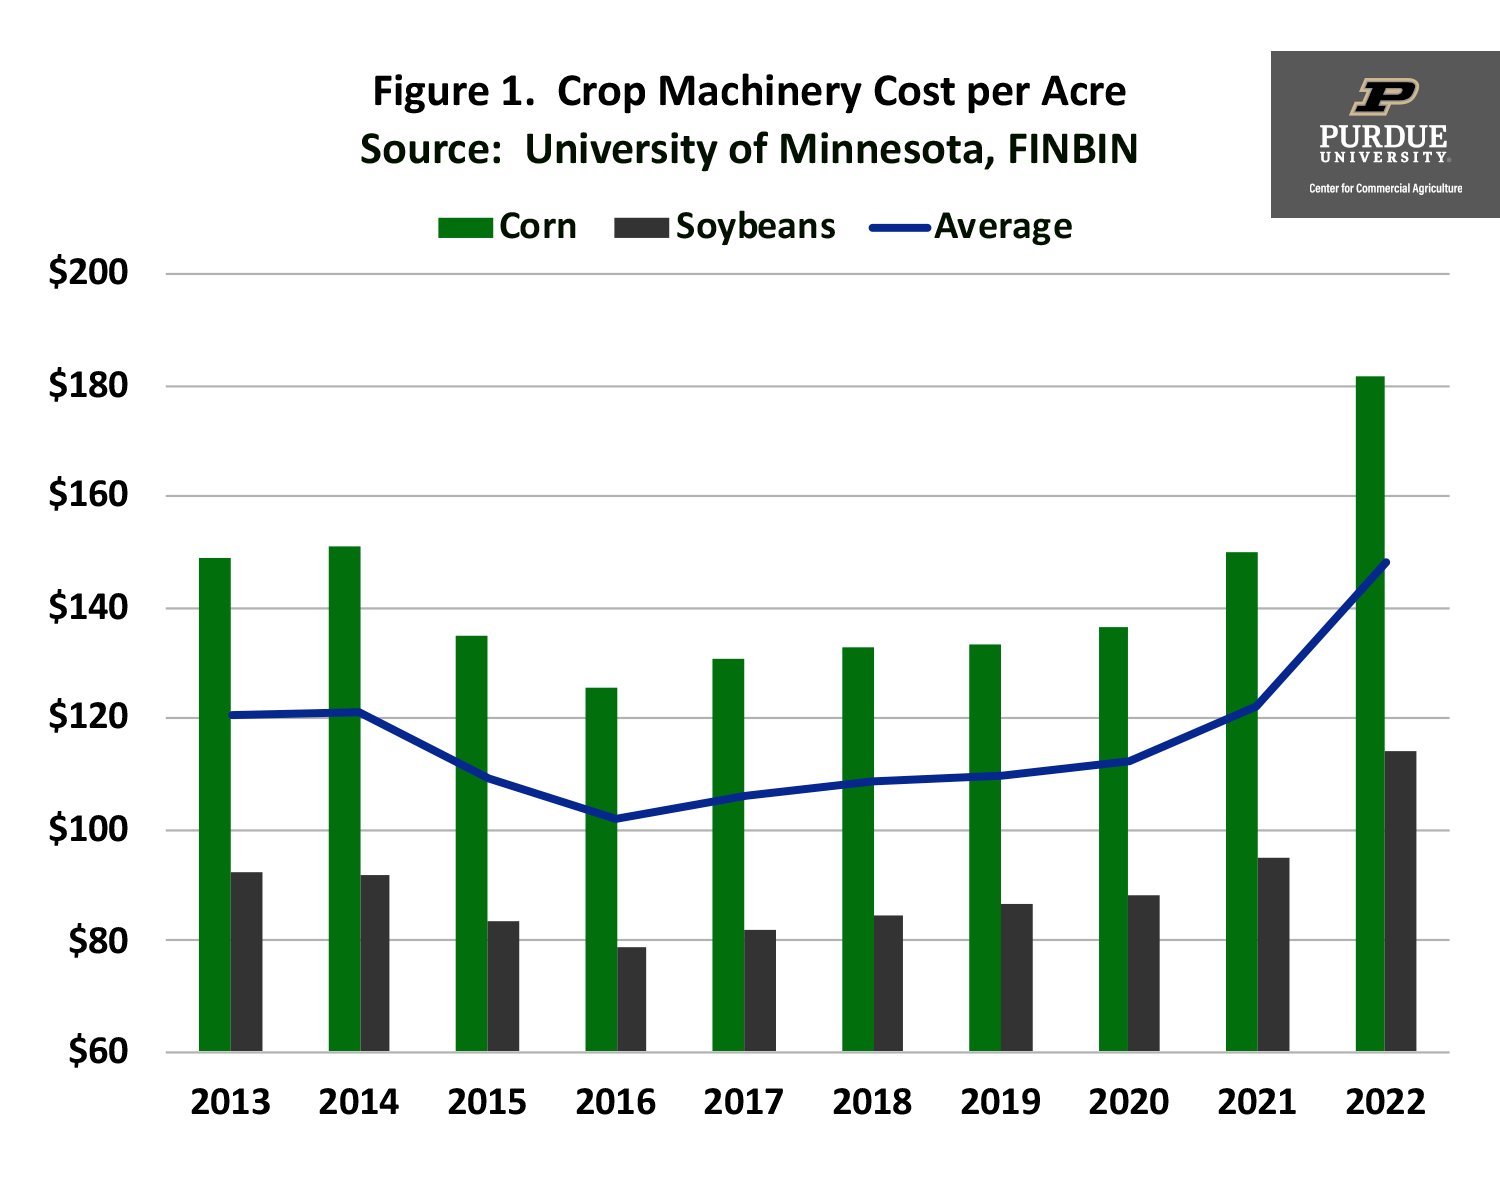
Figure 1. Crop Machinery Cost per Acre
To obtain some feel for how machinery cost varies among farms, we compared the average machinery cost per acre for corn farms in 2022 with the averages for corn farms in the low 20 percent group with respect to net return per acre and for corn farms in the high 20 percent group with respect to net return per acre. The average crop machinery cost per acre for corn was $182. The low profit group had an average machinery cost per acre of $209 or 15.2 percent higher than the average machinery cost. In contrast, the high profit group had an average crop machinery cost of $156 per acre or 14.4 percent lower than the average machinery cost.
Crop machinery investment per acre for the case farm was $483. Figure 2 presents crop machinery investment per acre for farms with data included in the FINBIN database. Unlike the crop machinery cost computations which focused on corn and soybean production, the crop machinery investment computations incorporated into figure 2 were for all farms categorized as crop farms. Average crop machinery investment per acre increased from $573 in 2021 to $695 in 2022, or 21.3 percent. The crop machinery investment per acre for the case farm is relatively low compared to the FINBIN average for 2022 of $695 per acre.
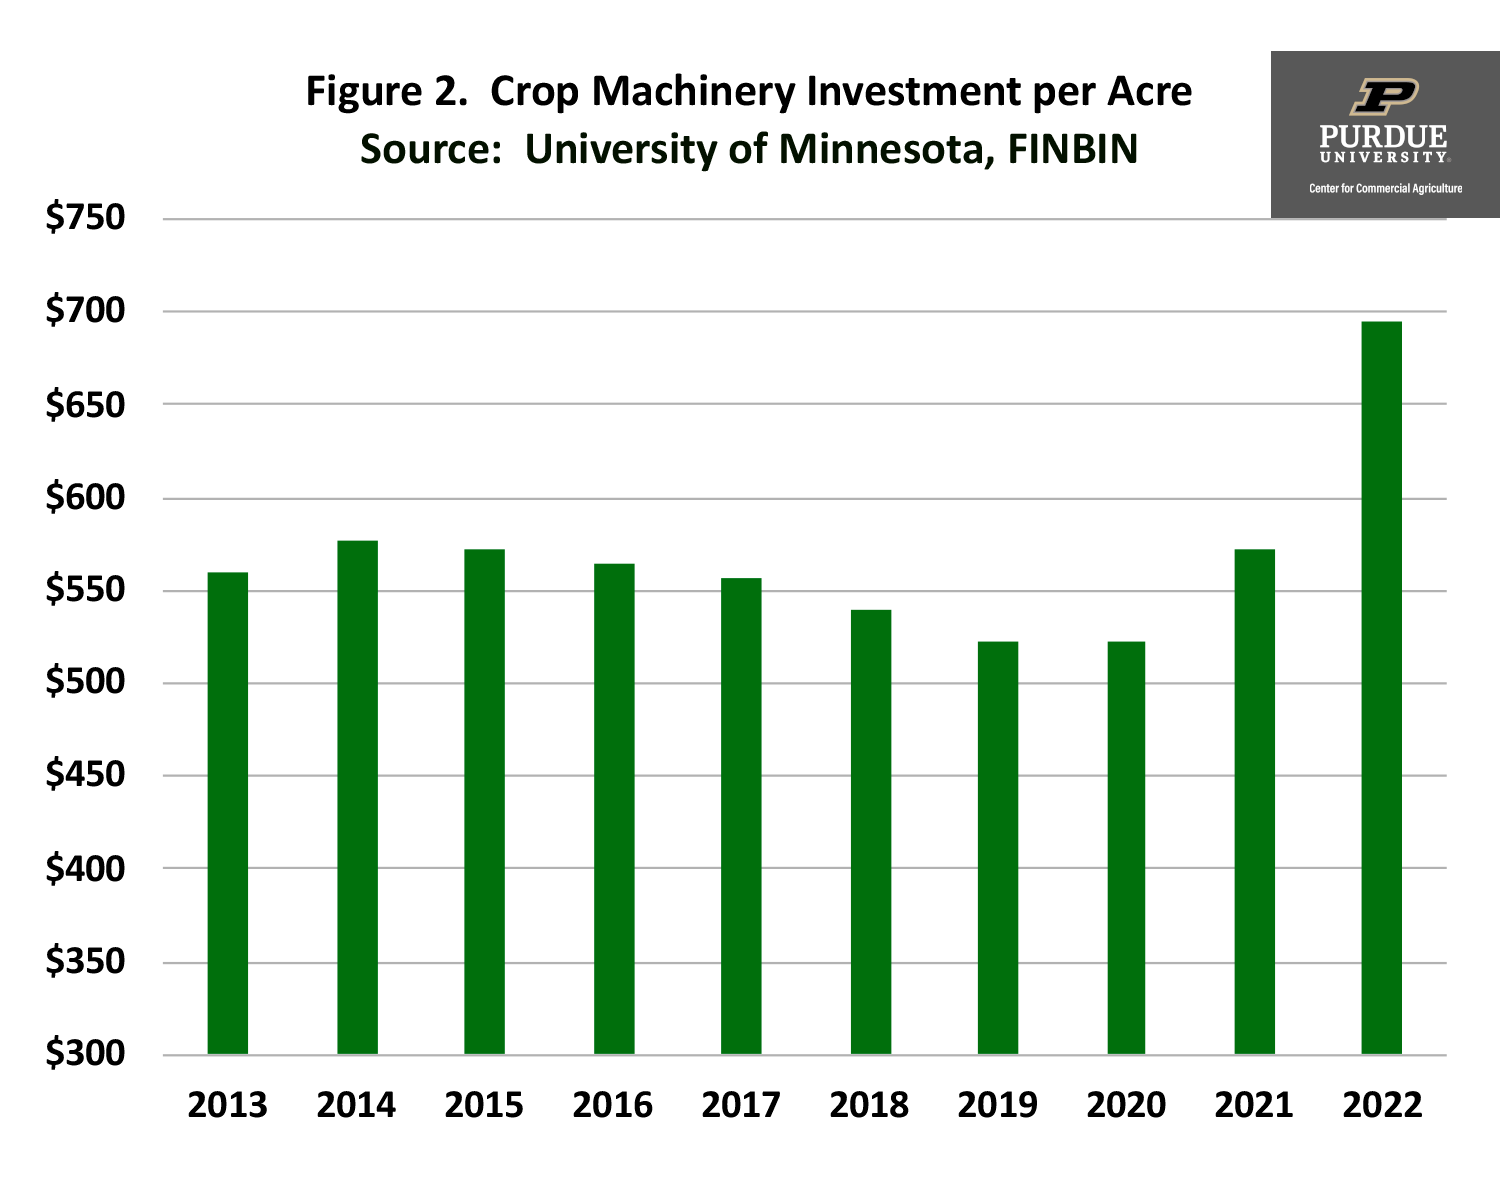
Figure 2. Crop Machinery Investment per Acre
Potential variability in crop machinery investment per acre was examined by comparing average machinery investment per acre to averages for farms in the low and high 20 percent groups in terms of net farm income. Again, data from 2022 were utilized. The average crop machinery investment per acre was $695. Farms in the low 20 percent group had an average machinery investment per acre of $863 or 24.2 percent higher than the average machinery investment. In contrast, farms in the high 20 percent profit group had an average machinery investment per acre of $650 or 6.5 percent lower than the average machinery investment. In addition to examining machinery investment per acre for the two profit groups, we examined machinery investment benchmarks for crop farms using 2022 data. Farms in the 30th percentile, meaning that 30 percent of the farms had values higher than this group, had an average machinery investment per acre of $1,011, while farms in the 70th percentile had an average machinery investment per acre of $457. When interpreting the average for the 70th percentile, a word of caution is in order. Farms with very low crop machinery investment values tend to have older machinery that is largely depreciated out. Whether these farms can continue operating with this machinery for several more years is an open question.
Finally, it is important to note that the case farm has strong labor benchmarks. Gross revenue per worker is approximately $1,500,000 for the case farm. In addition, the ratio of total labor expense (hired labor plus family and operator labor) as a percentage of value of farm production is only 4.9 percent. Given the potential tradeoff between labor cost and machinery cost, it is often important to compute both labor and machinery benchmarks.
Conclusions
This article defined, described, and illustrated crop machinery cost and investment benchmarks using a case farm in west central Indiana. The case farm had values that were below the specified benchmarks or targets. In order to more fully gauge farm efficiency, it would be helpful to also compare the farm’s profitability and financial efficiency ratios to farms of the same type and similar in size.
Citation
Center for Farm Financial Management, University of Minnesota, FINBIN web site, accessed June 5, 2023.
![]()
![]()
![]()
![]()
![]()
TAGS:
TEAM LINKS:

RELATED RESOURCES
Margaret Lippsmeyer presented during agri benchmark’s 2024 annual conference in mid June, which was hosted by the Spanish Ministry of Agriculture in Valladolid, Spain. An increase in soybean acreage may come from either (a) shifting away from continuous corn rotations to corn-soy and (b) shifting corn-soy rotations toward corn-soy-soy. Based on agri benchmark data, Margaret showed that option (a) would require an increase in soybean prices of 6% and option (b) of 8% to make these rotations preferable over existing ones.
READ MOREUPCOMING EVENTS
We are taking a short break, but please plan to join us at one of our future programs that is a little farther in the future.