


August 10, 2023
Comparing Net Returns for Alternative Leasing Arrangements
by Michael Langemeier
![]()
![]()
![]()
![]()
![]()
Obtaining control of land through leasing has a long history in the United States. Leases on agricultural land are strongly influenced by local custom and tradition. However, in most areas, landowners and operators can choose from several types of lease arrangements. With crop share arrangements, crop production and often government payments and crop insurance indemnity payments are shared between the landowner and operator. These arrangements also involve the sharing of at least a portion of crop expenses. Fixed cash rent arrangements, as the name implies, provide landowners with a fixed payment per year. Flexible cash lease arrangements provide a base cash rent plus a bonus which typically represents a share of gross revenue in excess of a certain base value or threshold. Each leasing arrangement has advantages and disadvantages. These advantages and disadvantages are discussed on the Ag Lease 101 web site. Rather than focusing on the advantages and disadvantages of various lease arrangements, this article uses a case farm in west central Indiana to illustrate net returns to land derived from crop share, fixed cash rent, and flexible cash lease arrangements. This article updates an article written by Langemeier (2022).
Leasing Arrangements
Net return to land from 2007 to 2023 from a landowner perspective were computed for a case farm in west central Indiana. Information for 2023 was projected using income and cost projections in early September. The case farm had 3000 crop acres and utilized a corn/soybean rotation. Lease arrangements examined included a crop share lease, a fixed cash rent lease, and a flexible cash lease.
With the crop share lease the landlord received 50 percent of all revenue (crop revenue, government payments, and crop insurance indemnity payments). In addition to providing the land, the landowner paid 50 percent of seed, fertilizer, and chemical (herbicides, insecticides, and fungicides) expenses as well as 50 percent of crop insurance premiums. The case farm participated in government programs (e.g., ARC-CO and PLC programs), and purchased 85 percent revenue protection coverage.
Fixed cash rents were obtained from the annual Purdue Farmland Value Survey. Specifically, cash rents for average productivity land in west central Indiana were used. The flexible cash lease arrangement used a base cash rent that was 90 percent of fixed cash rent. In addition to the base case rent, the landowner received a bonus of 50 percent of the revenue above non-land cost plus base cash rent if revenue exceeded non-land cost plus base cash rent. Revenue included crop revenue, government payments, and crop insurance indemnity payments. All cash and opportunity costs, except those for land, were included in the computation of non-land cost. More discussion regarding possible parameters that can be used for flexible cash leases can be found in Langemeier (2018).
Comparisons of Net Return to Land among Leasing Arrangements
Before making comparisons between leases, we will briefly discuss bonus payments for the flexible cash lease. Per acre bonus payments for the flex cash lease arrangement are illustrated in figure 1. During the 2007 to 2023 period, bonus payments were incurred in 10 years. Bonus payments ranged from $0 to $137 per acre, and averaged $38 over the 2007 to 2023 period. From 2007 to 2013, the average bonus payment was $59 per acre. The annual bonus payment from 2014 to 2019 was zero. The bonus payment from 2020 to 2022 averaged approximately $79 per acre. The projected bonus payment for 2023 is $0. The largest bonus payment, $137 per acre, occurred in 2021.
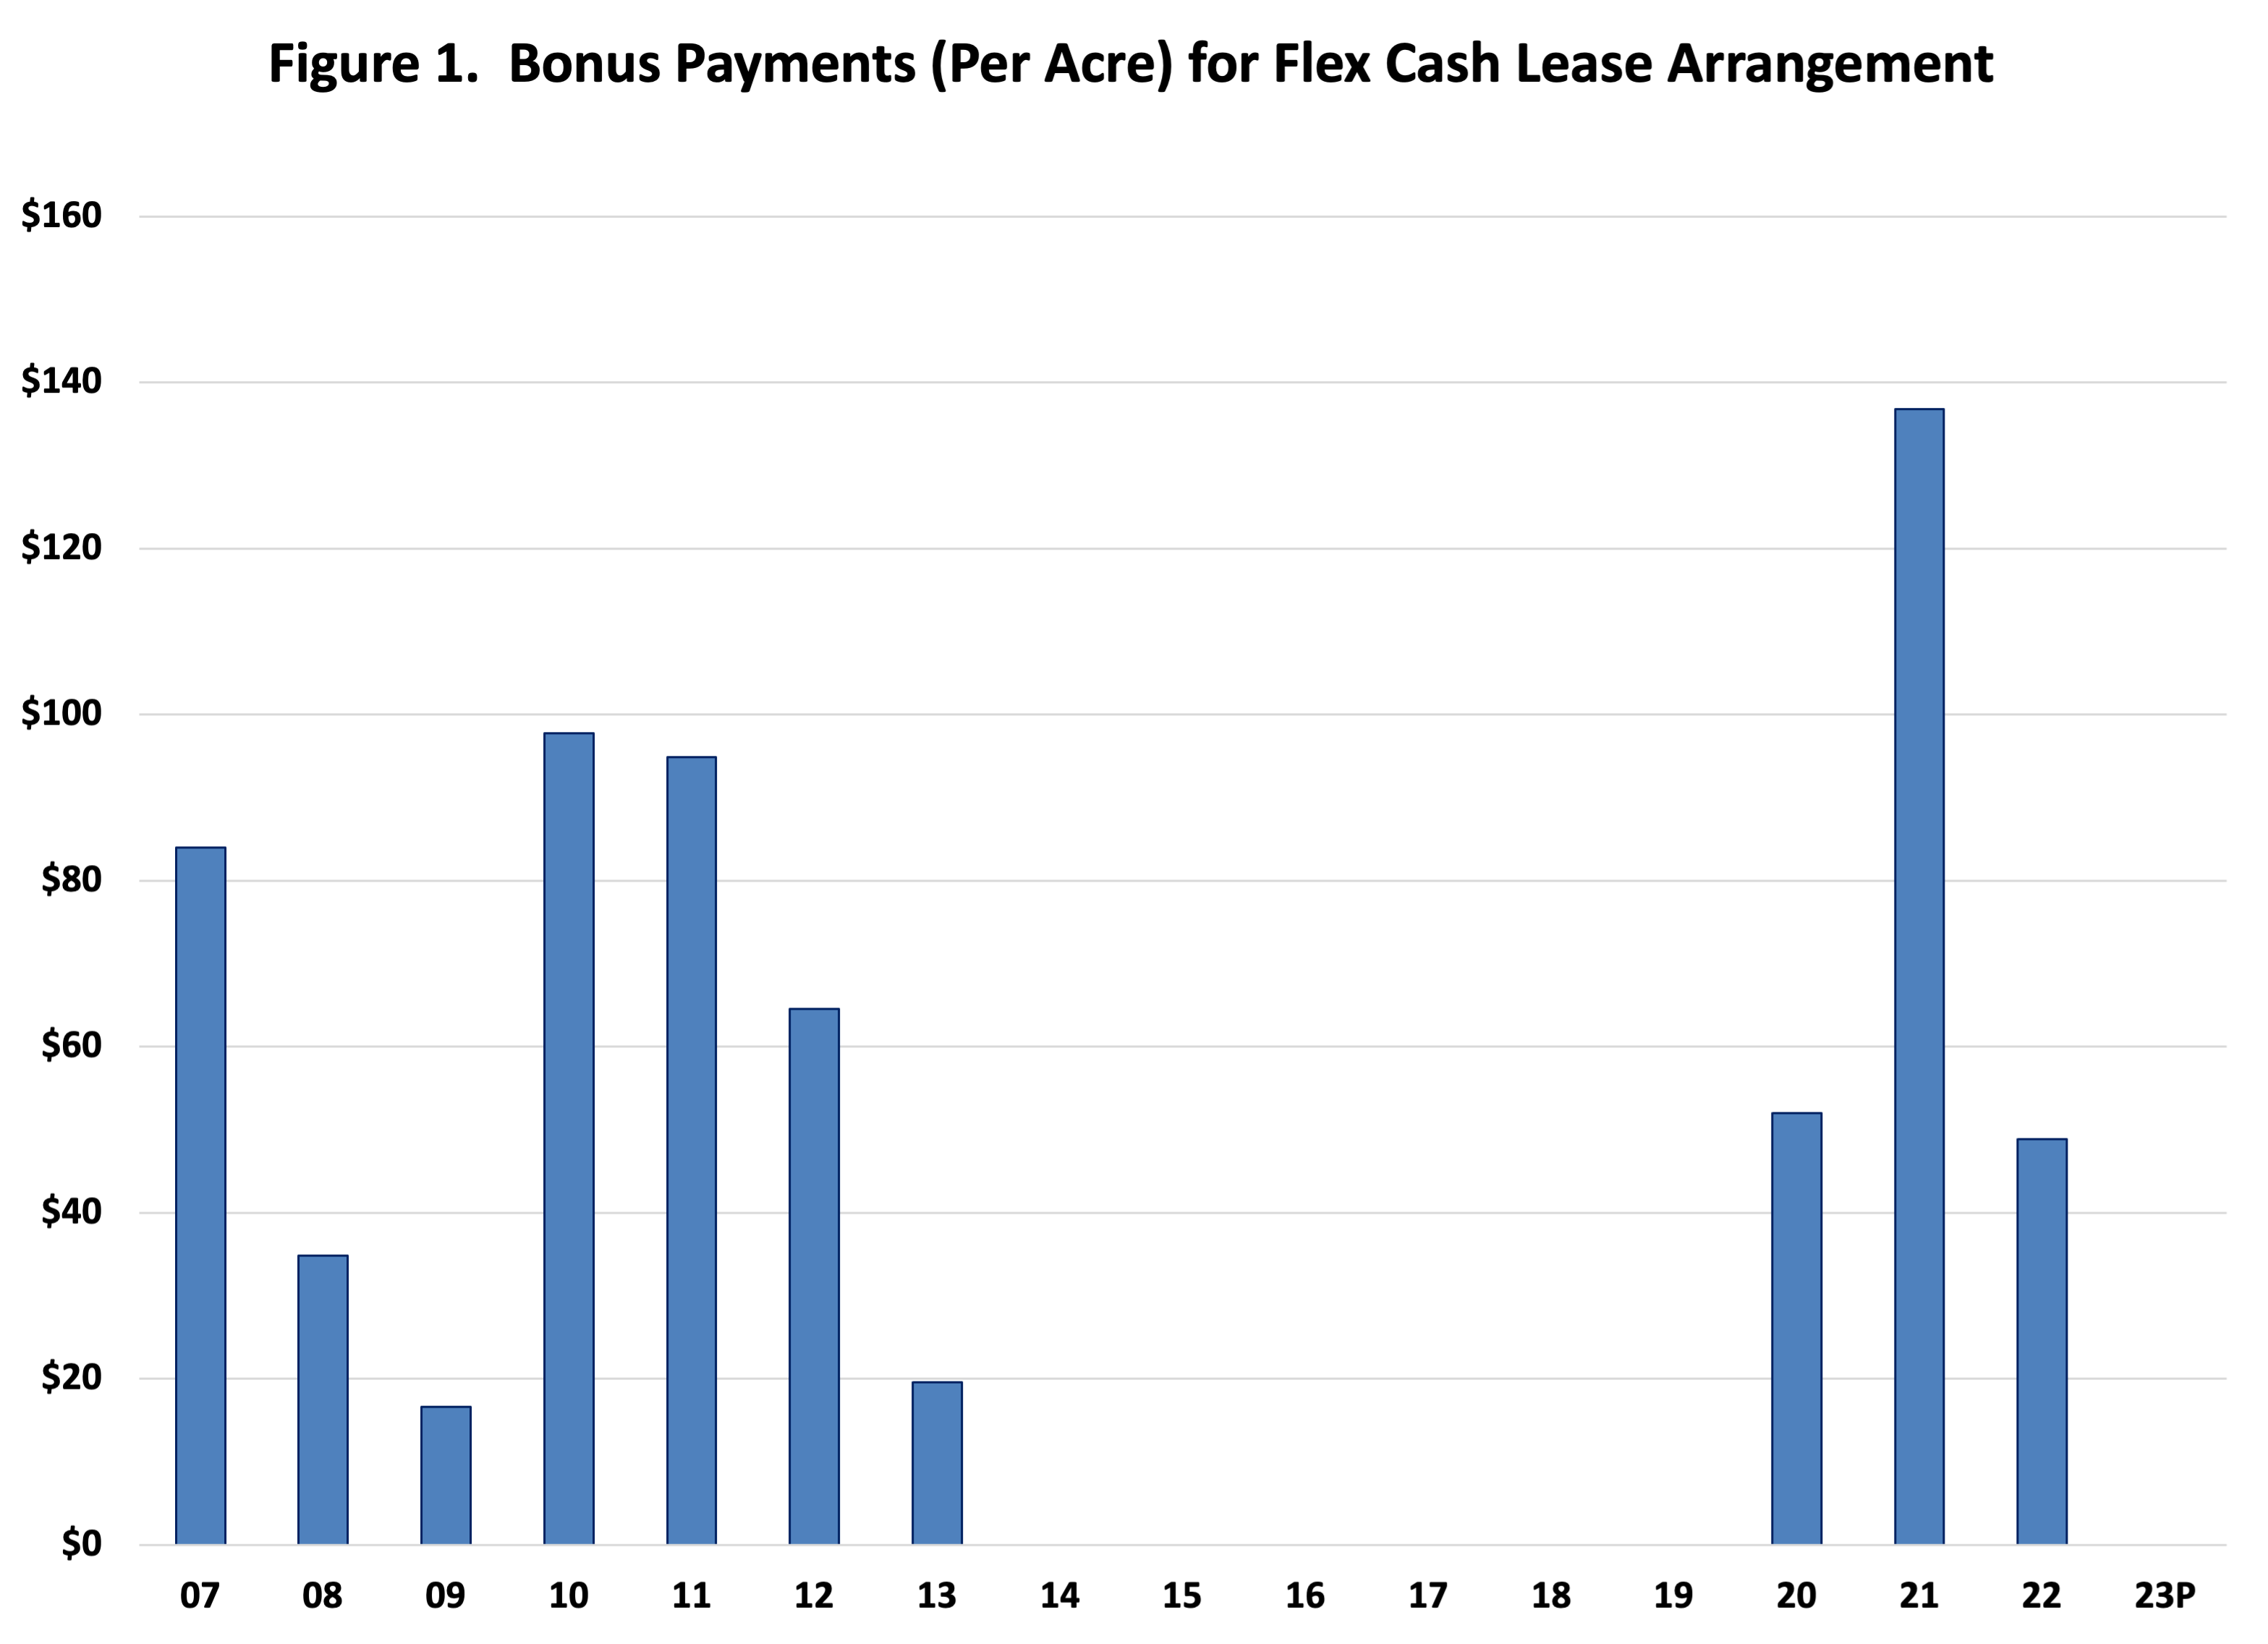
Figure 1. Bonus Payments (Per Acre) for Flex Cash Lease Arrangement
Pairwise comparisons were used to compare the three leasing arrangements. Figure 2 compares the crop share lease to the fixed cash rent lease. The landowner net return for the crop share lease was more variable. As would be expected, net return for the crop share lease increased faster when revenue was increasing, but also decreased more rapidly when revenue was declining. The net return for the crop share lease was higher than the net return for the fixed cash rent lease from 2007 to 2012. From 2013 to 2019, the net return for the crop share lease was from $29 per acre (in 2019) to $122 per acre (in 2015) below the net return for the fixed cash rent lease. On average, from 2013 to 2019, the net return for the crop share lease was $57 per acre below the net return for the fixed cash rent lease. From 2020 to 2022, the net return for the crop share lease was from $12 to $98 higher than the net return for the fixed cash rent lease. The average difference during the 2020 to 2022 period was $41 per acre. The crop share lease is projected to be $72 per acre lower than fixed cash rent in 2023.
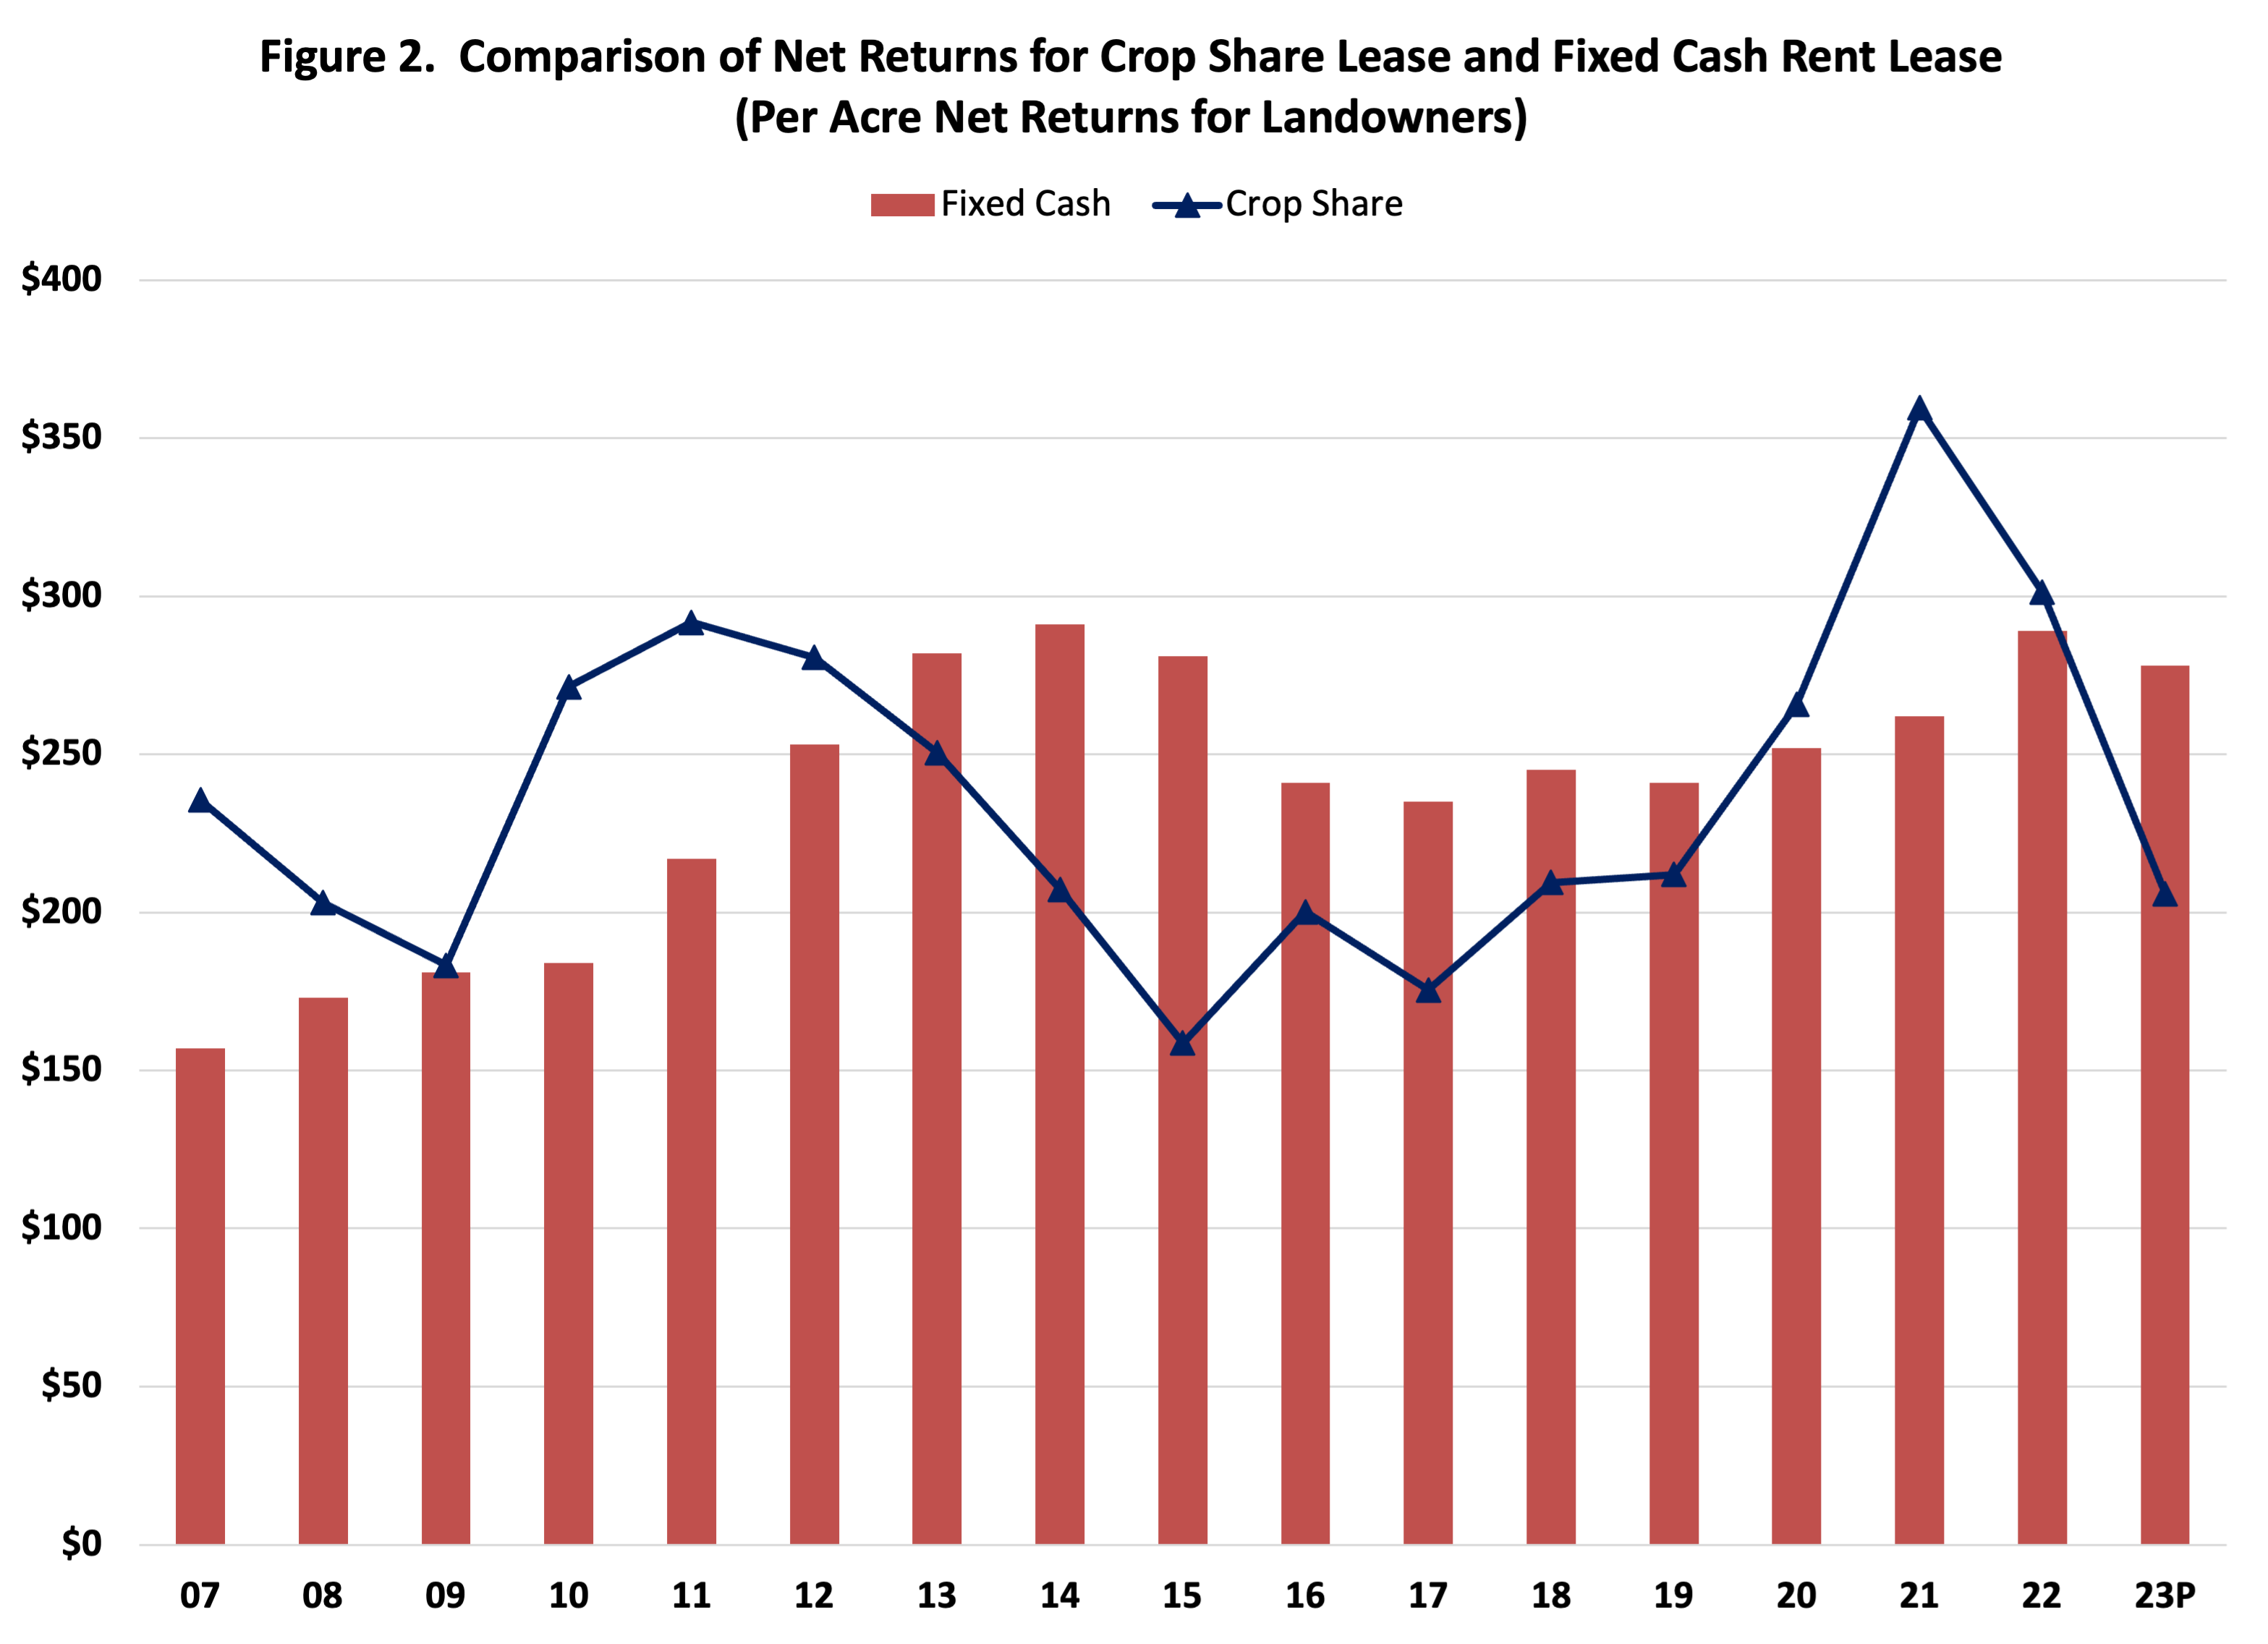
Figure 2. Comparison of Net Returns for Crop Share Lease and Fixed Cash Rent Lease
(Per Acre Net Returns for Landowners)
Figure 3 compares the net return for the flexible cash lease to the net return for the fixed cash rent lease. This graph looks remarkably similar to figure 2. Net returns for the flexible cash lease were more volatile than the net returns for the fixed cash rent lease. The net return for the flexible cash lease was relatively higher in 2007-2008, 2010-2012, and 2020-2022. During the 2007 to 2013 period, the average net return for the flexible cash lease was similar to the average net return for the share rent lease, and $38 per acre higher than the average net return for the fixed cash rent lease. From 2014 to 2019, the annual net return for the flexible cash rent lease was on average $26 per acre below the net return for the fixed cash rent lease. However, it is important to note that during this same period the net return for the flexible cash lease was $36 per acre higher than the net return for the crop share lease. From 2020 to 2022, the net return for the flexible cash lease was $52 per acre higher than the net return for the fixed cash rent lease and $11 per acre higher than the net return for the crop share lease.
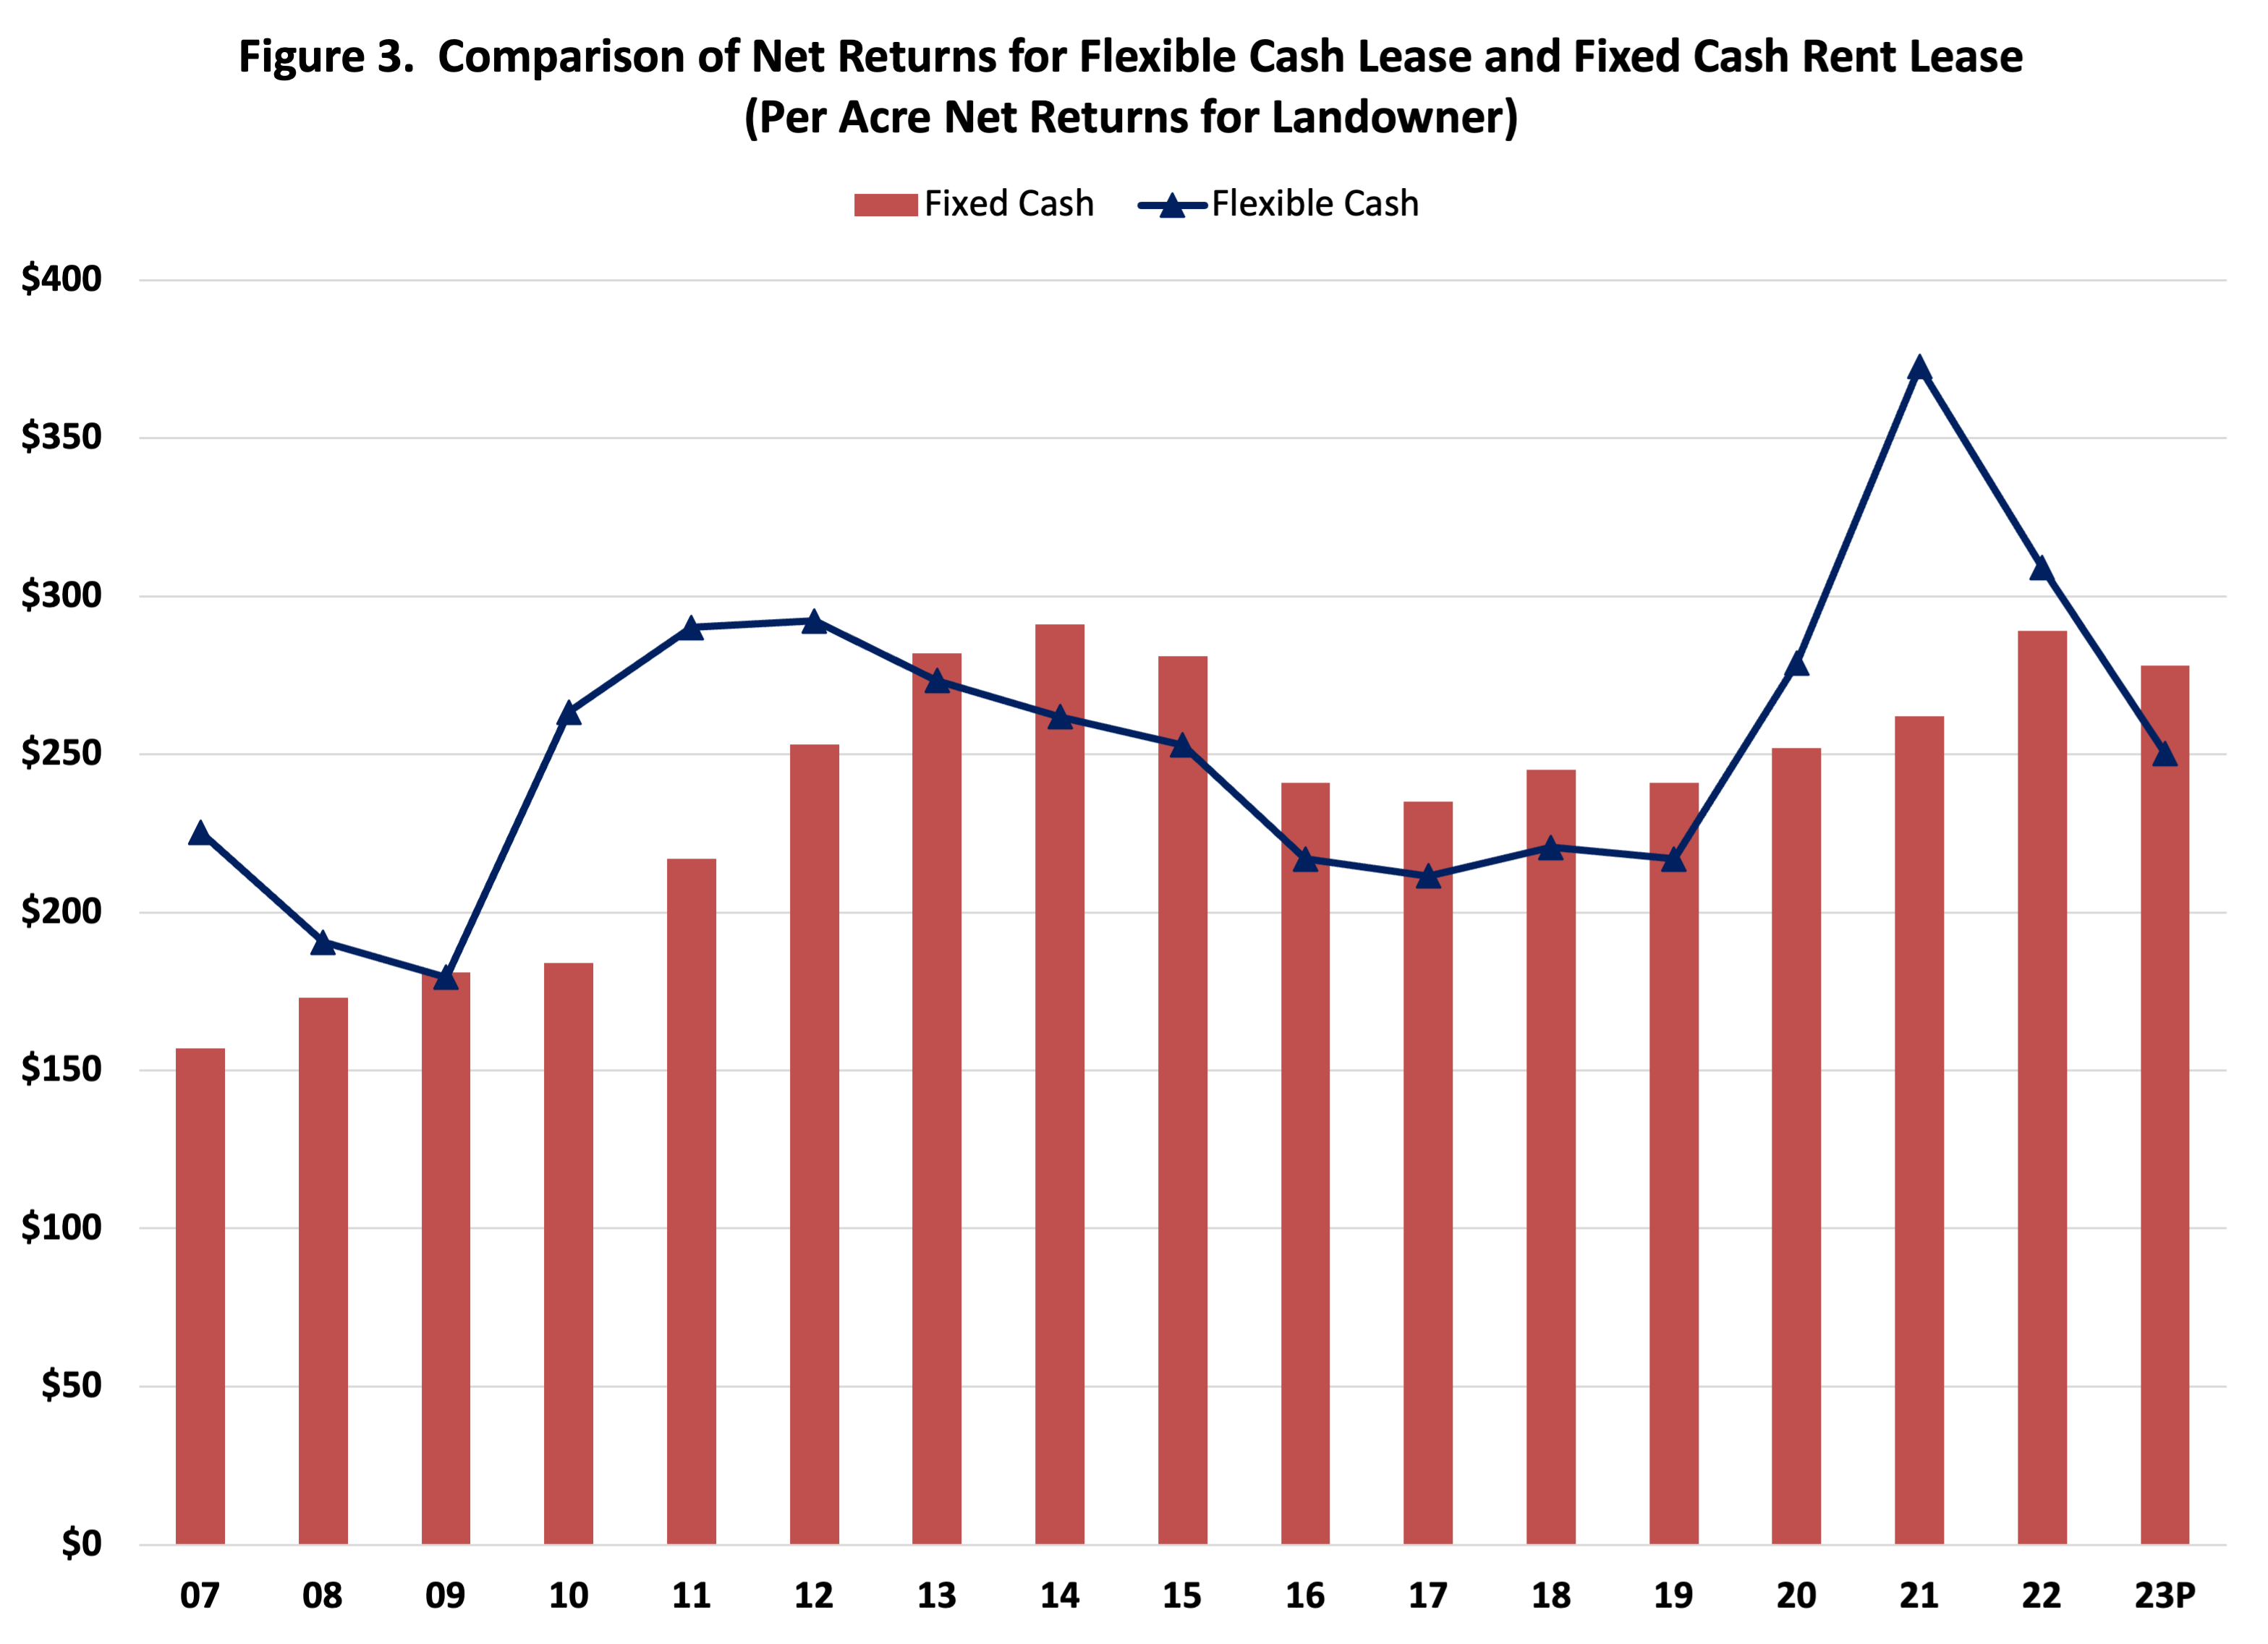
Figure 3. Comparison of Net Returns for Flexible Cash Lease and Fixed Cash Rent Lease
(Per Acre Net Returns for Landowner)
Differences between the fixed cash rent lease and the other two leasing arrangements are illustrated in figure 4. This chart was created by subtracting fixed cash rent payments per acre from the net return for the flexible cash lease and the net return for the crop share lease. As noted above, the net returns for the flexible cash lease mimic those for the crop share lease. However, there are a few differences in the trends for these two leases. The flexible cash lease did not increase as much as the crop share lease in 2007, 2008, and 2010. More importantly, from a downside risk perspective, the flexible cash lease did not decrease as rapidly as the crop share lease from 2013 to 2015 and in 2023, and was relatively higher from 2016 through 2022.
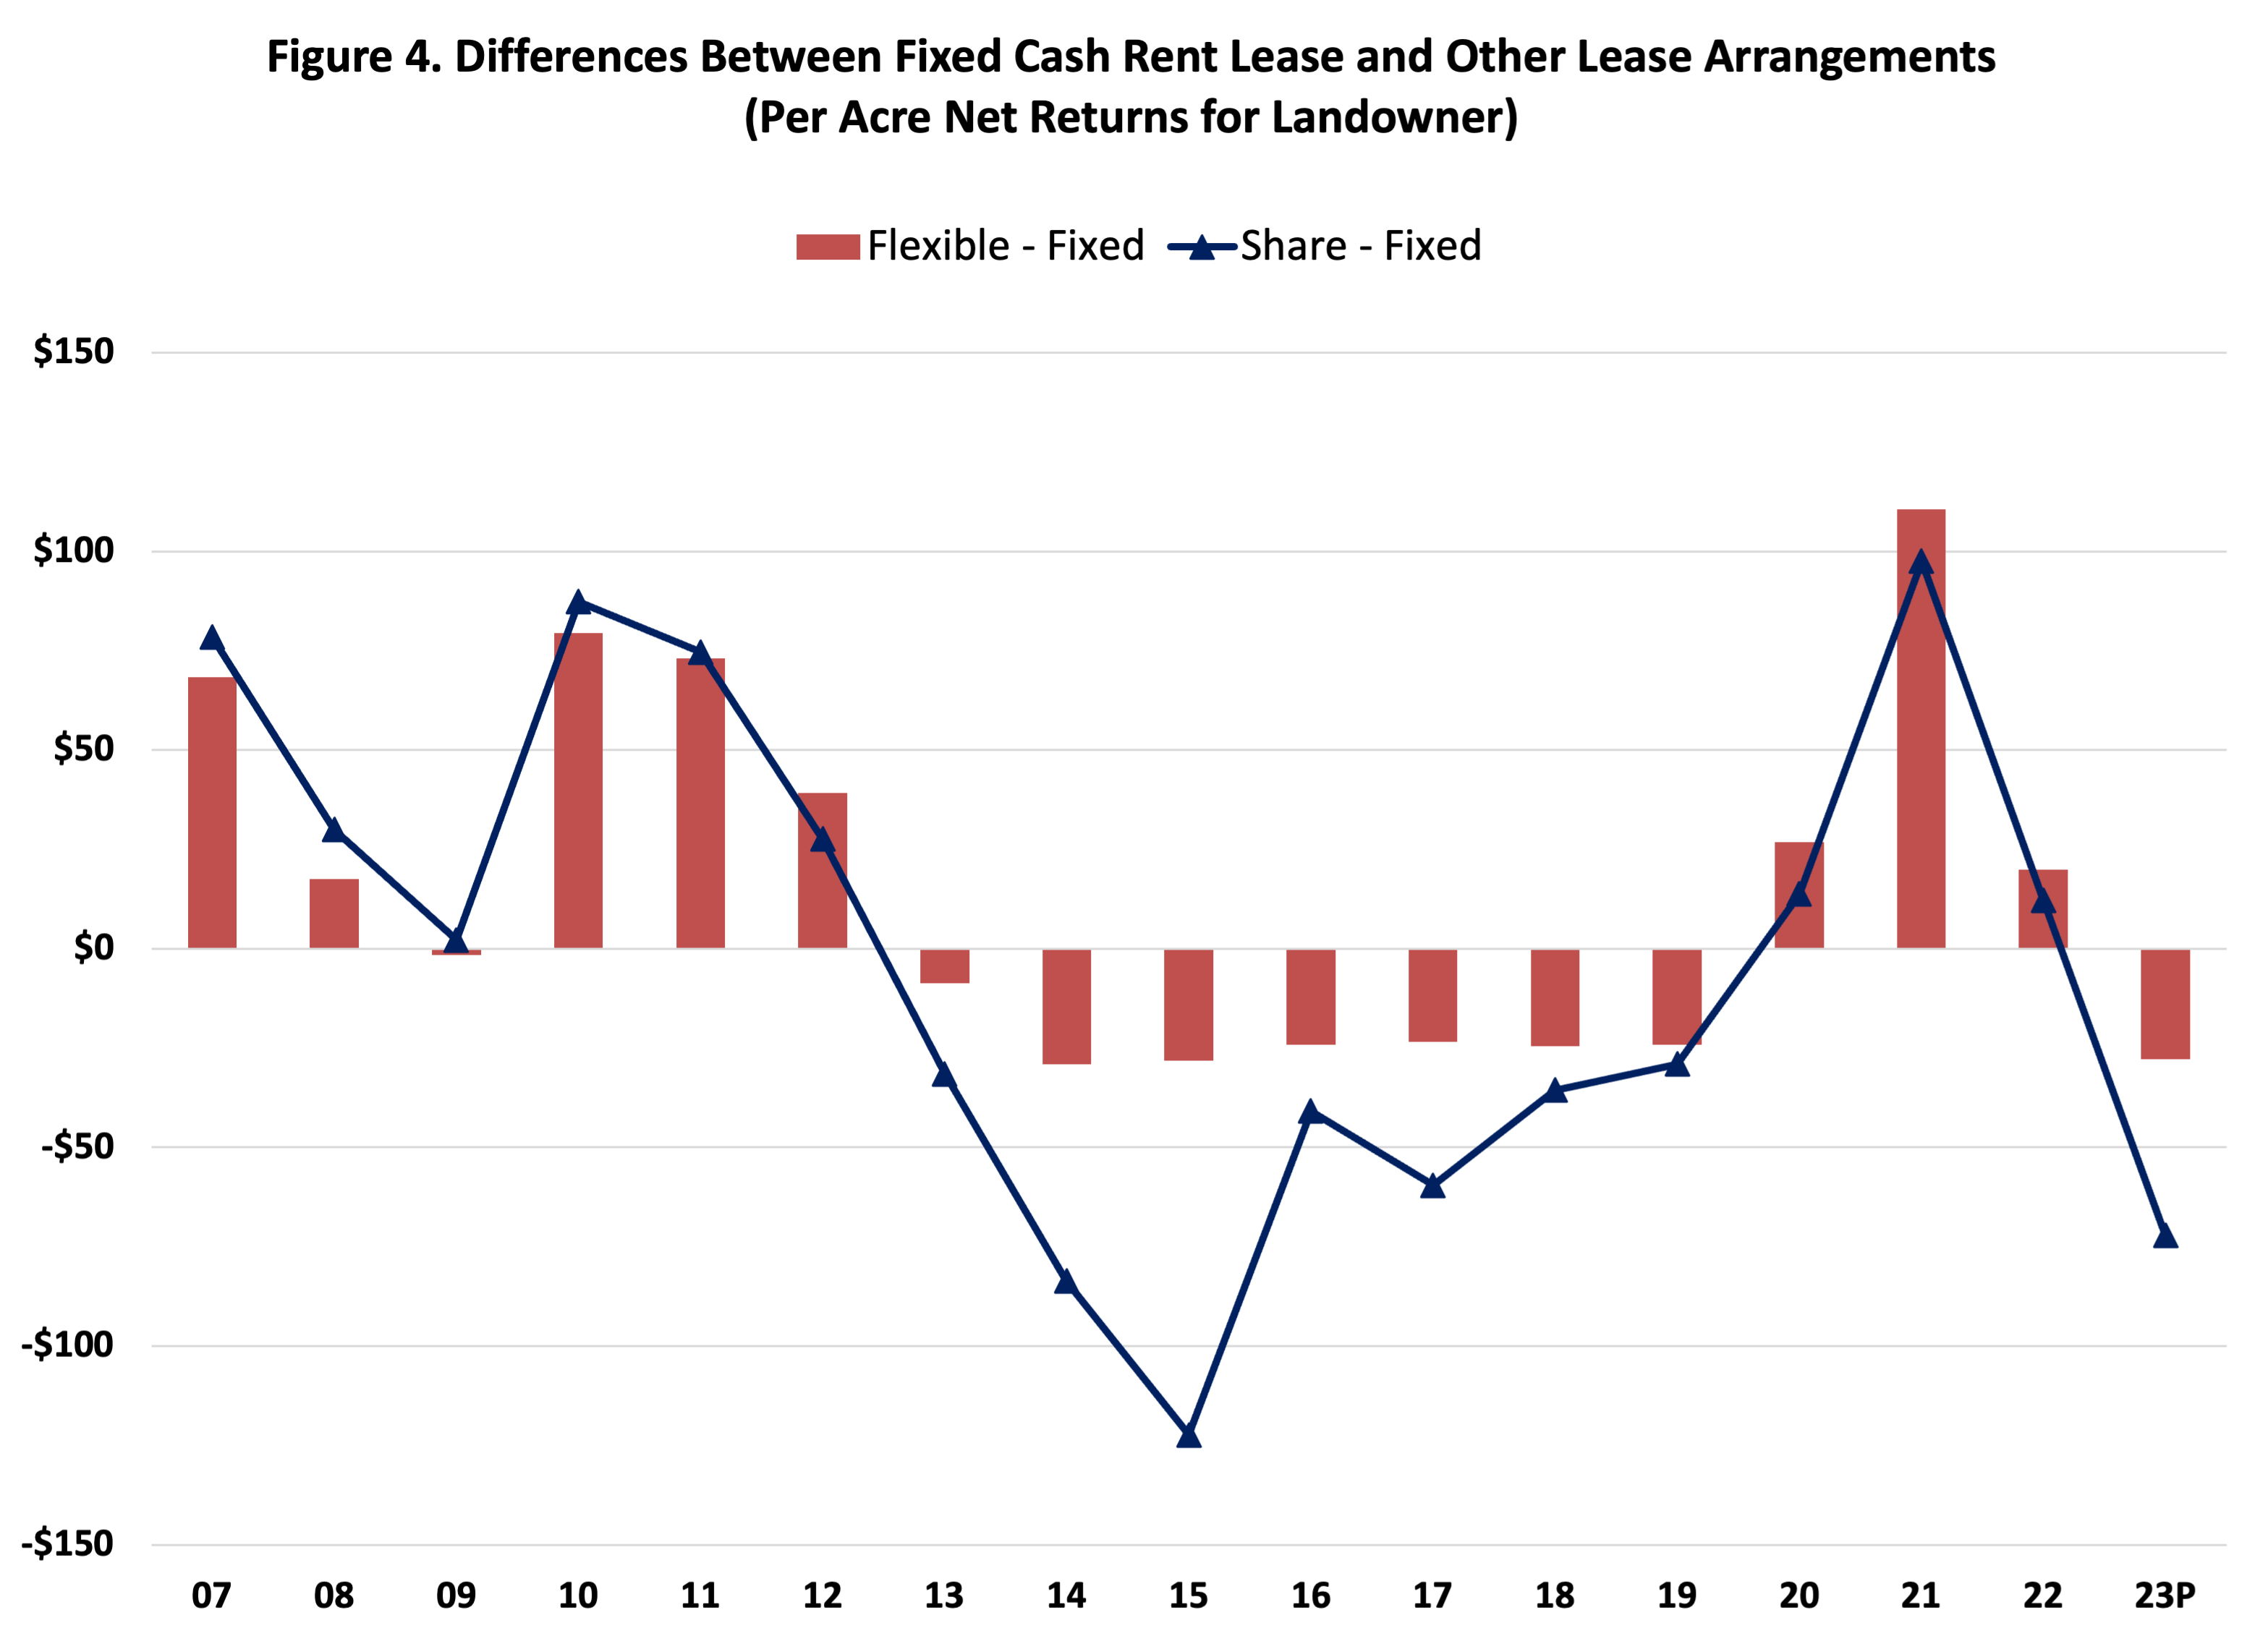
Figure 4. Differences Between Fixed Cash Rent Lease and Other Lease Arrangements
(Per Acre Net Returns for Landowner)
What about differences in the potential net returns for the three crop leases in 2024? Early projections for 2024 show a potential bonus for the flexible cash rent lease of $0. The crop share lease is also projected to have lower net returns than both the fixed cash rent lease and the flexible cash rent lease. Continued high input prices are adversely impacting potential net returns for crop share leases. Of course, the projections for 2024 are sensitive to income and cost budget assumptions.
Summary and Conclusions
This article used a case farm in west central Indiana to compare the net return to land for crop share, fixed cash rent, and flexible cash leases. The average net returns to land from a landowner perspective were similar among the three lease arrangements. The flexible cash lease mimicked the ups and downs of the crop share lease. However, the upward and downward spikes for the flexible cash lease were less pronounced than those for the crop share lease. Choosing among the leases depends on a landowner’s desire to capture improvements in crop share revenue and ability to withstand downside risk. The crop share and flexible cash leases allow landowners to more fully capture annual improvements in crop revenue, but also increase the probability of downward movements in annual net returns.
References
Ag Lease 101, www.aglease101.org/, accessed August 25, 2023.
Langemeier, M. “Flexible Cash Lease Comparisons.” Center for Commercial Agriculture, Purdue University, October 6, 2018.
Langemeier, M. “Comparing Net Returns for Alternative Leasing Arrangements.” Center for Commercial Agriculture, Purdue University, September 2, 2022.
![]()
![]()
![]()
![]()
![]()
TAGS:
TEAM LINKS:

RELATED RESOURCES
UPCOMING EVENTS
We are taking a short break, but please plan to join us at one of our future programs that is a little farther in the future.