August 7, 2023
Forecasting New Crop Basis Bids for Fall 2023
by Nathanael Thompson
![]()
![]()
![]()
![]()
![]()
We are now in the final weeks of the 2022-2023 crop marketing year, and after what has been a wild year for corn and soybean basis, basis bids for old crop corn and soybeans have largely settled and are in alignment with historical values for this time of year in most regions across the eastern Corn Belt. For this reason, in this article I want to briefly turn our attention to forecasting new crop basis bids for fall of 2023 using the updated Purdue Center for Commercial Agriculture Crop Basis Tool.
Forecasting New Crop Basis Using the Crop Basis Tool
In May 2023 we introduced an updated version of the Crop Basis Tool that offers users a variety of new features. One of those features is the flexibility of evaluating new crop basis bids using historical basis information. While the Crop Basis Tool automatically defaults to displaying basis patterns for the current crop marketing year, users have the ability to change these selections. Below I describe how a user would use the tool to examine new crop basis bids for fall 2023.
- When you arrive at the tool you are going to automatically see nearby basis values for the most recent marketing years as well as the current crop marketing year for the crop, state, and region that you select. But if you are interested in new crop basis bids for the 2023-2024 crop year, you need to change some of the selections.
- First, focusing on basis bids for fall 2023 delivery, I would change the Futures Contract selection from Nearby to December futures for corn or to November futures for soybeans. This will provide you a drilled down look at basis patterns during the fall delivery period.
- Next, you need to change the Historical Crop Years to Average Across. While the tool defaults to the most recent three complete marketing years for corn (2019-2020, 2020-2021, and 2021-2022) and the most recent two complete marketing years for soybeans (2020-2021, and 2021-2022), the current crop marketing year which is not yet completed (2022-2023) is available to be selected and averaged across. So, to view the most recent three years for the 2023-2024 crop marketing year you would select 2020-2021, 2021-2022, and 2022-2023. This average (the blue line in the chart) gives you a forecast or expectation of basis patterns this fall.
- The tool also allows users to view basis data for any number of individual crop years. While the tool defaults to the current crop marketing year (2022-2023), this information may or may not be helpful for examining forecasts for 2023-2024 basis given that this information is now incorporated in to the average of historical crop years calculated in the step above. For this reason, I like to turn off the 2022-2023 basis line (the black line on the default chart) by clicking on the legend label at the bottom of the chart.
- Figure 1 provides an example of what this would look like for corn basis in Central Indiana.
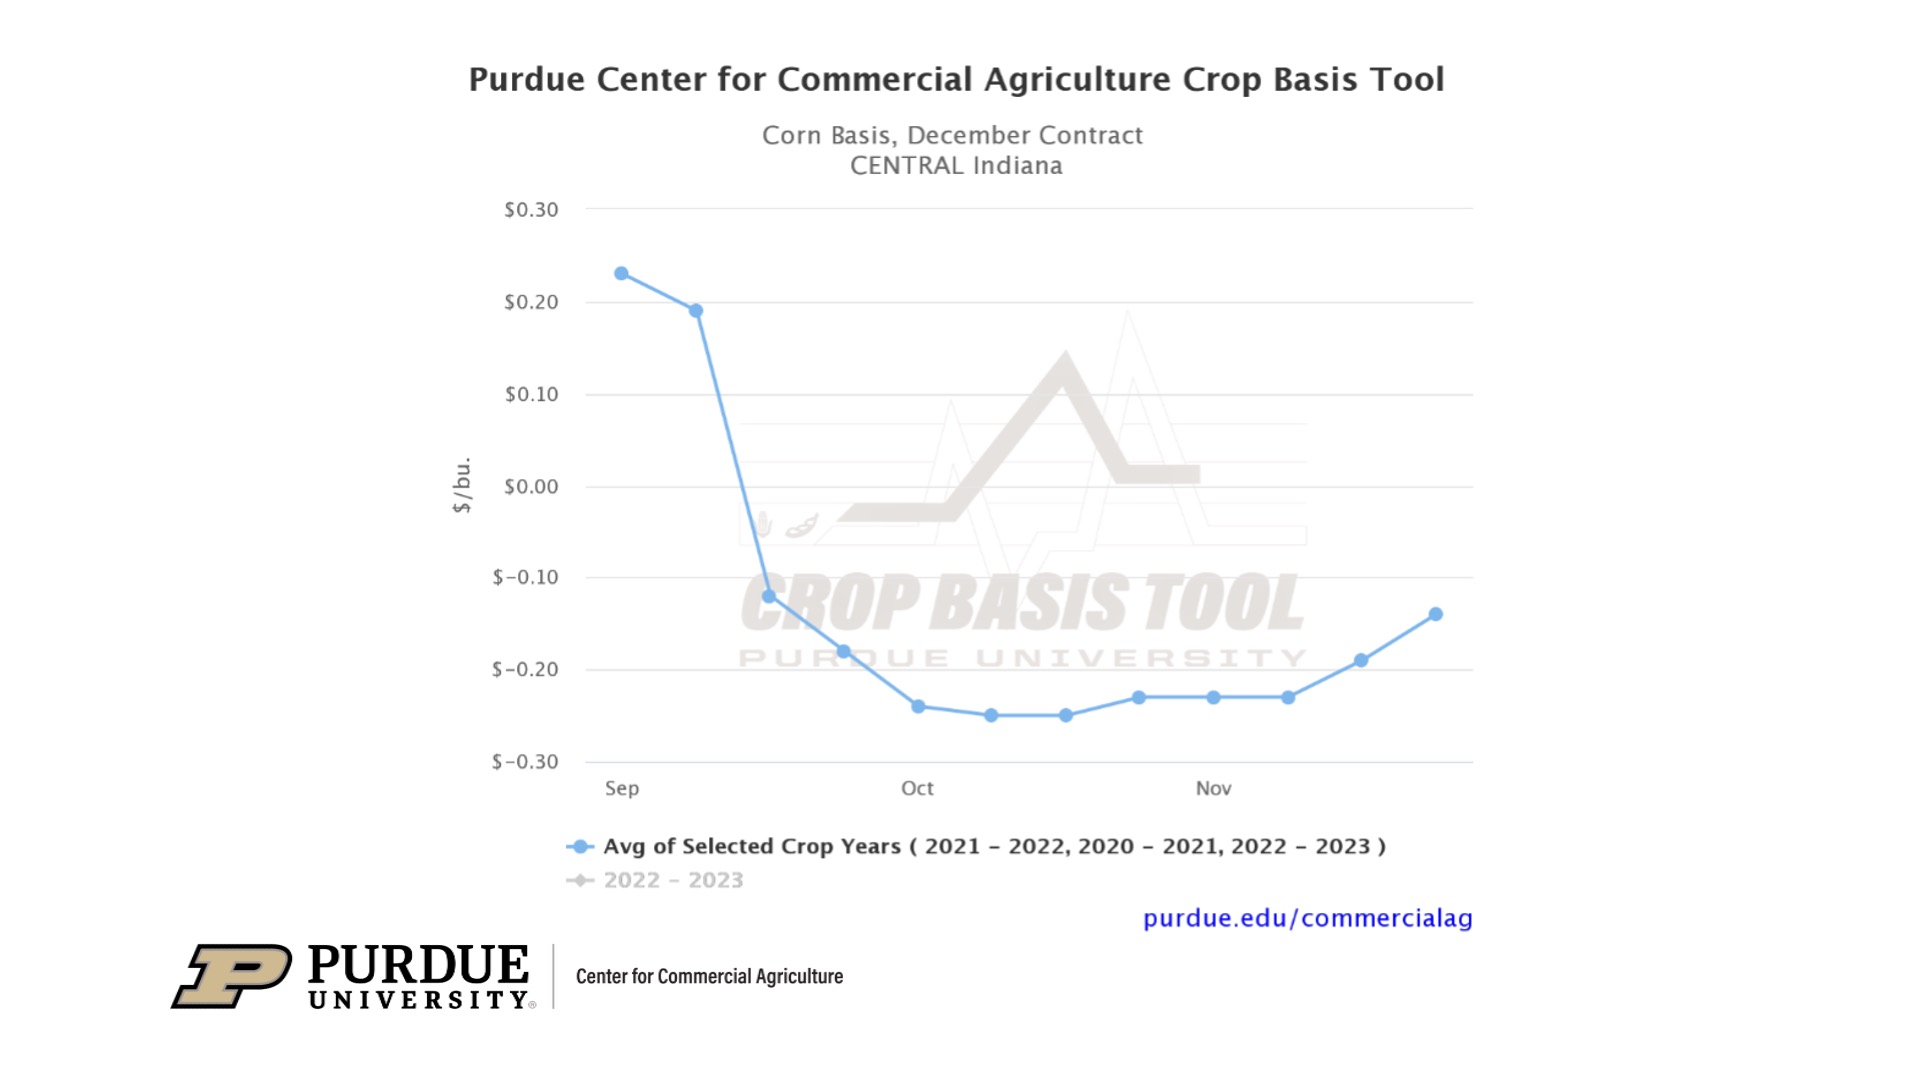
Figure 1. Three-Year Average (2020-2021, 2021-2022, and 2022-2023) Central Indiana December Contract Corn Basis as a Forecast of 2023-2024 Corn Basis for Fall Delivery
As you can see in Figure 1, basis bids for delivery in October 2023 would be $0.20-$0.25/bu. under December ’23 Corn Futures based on the three-year average forecast. Looking at basis bids for fall delivery of new crop corn, this is very consistent with current bids at actual elevators in Central Indiana. This is an indication that the current expectation is we will have a “normal” crop in Central Indiana. However, local supply and demand conditions can impact how actual basis bids relate to this historical average. For example, if we were facing a drought situation with the expectation that Central Indiana would have a short crop, then I would expect current bids at elevators in Central Indiana would be stronger than this historical average indicating the region’s need to pull corn in. On the other hand, if we were expecting a very big crop in Central Indiana, then I would expect actual basis bids to be weaker than this historical average as an indication of surplus supply.
In addition to differences in local supply and demand, basis patterns may also be impacted by the type of buyer you are selling to, such as an elevator, ethanol plant, or soybean processor. The example above is a regional average of all corn or soybean buyers within a particular crop reporting district and does make distinction for different types of buyers. However, the updated crop basis tool allows users to look at basis patterns for different buyer types to examine how this might impact new crop basis bids. For example, Figure 2 shows the same sort of new crop corn basis expectation for delivery in fall 2023, but looks at ethanol plants specifically.
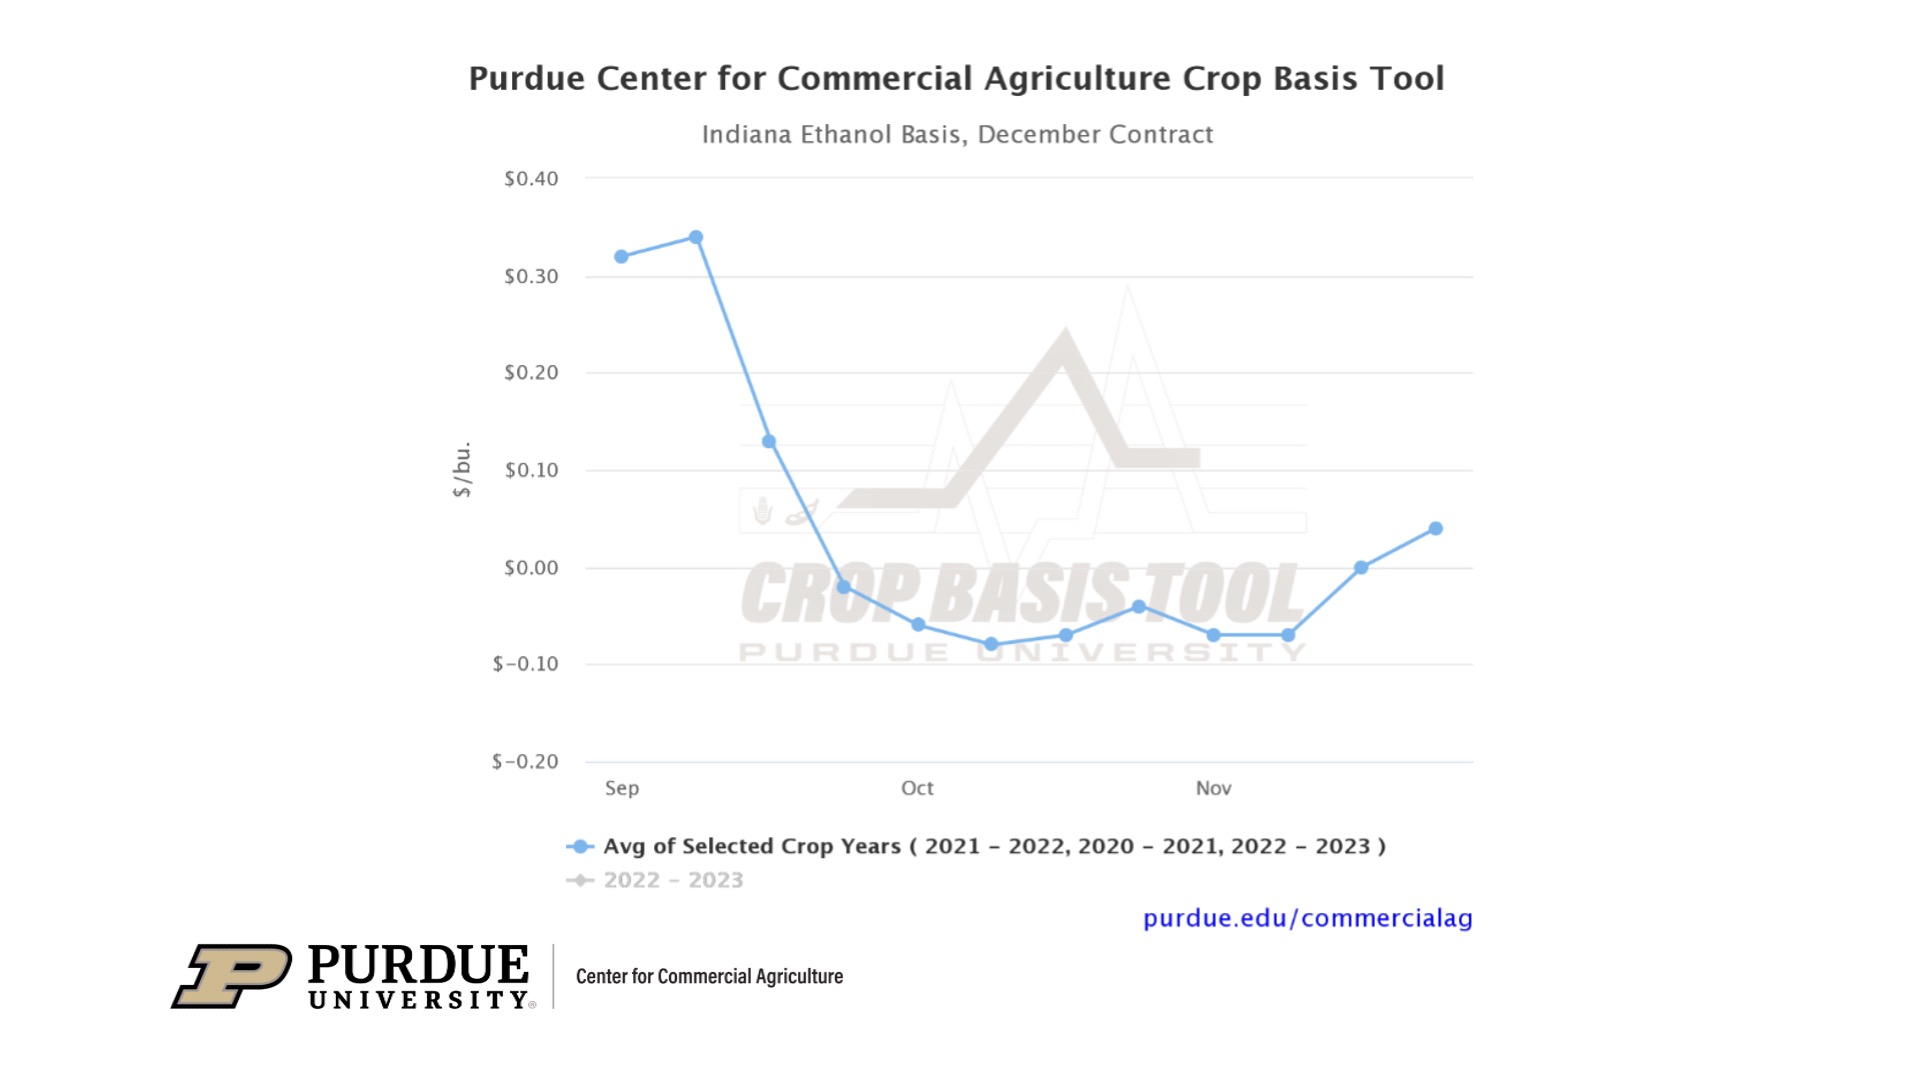
Figure 2. Three-Year Average (2020-2021, 2021-2022, and 2022-2023) Indiana Ethanol Plant December Contract Corn Basis as a Forecast of 2023-2024 Corn Basis for Fall Delivery at Indiana Ethanol Plants
As you can see, the basis forecast for fall 2023 delivery of corn at Indiana ethanol plants is $0.05-$0.10/bu. under December ’23 corn futures, which is nearly $0.20/bu. stronger than the basis forecast for delivery at all locations. Interestingly, looking at the current basis bids for fall delivery at Indiana ethanol plants, they are generally weaker than what the historical data forecast suggests—I have seen current basis bids for fall delivery at Indiana ethanol plants ranging from $0.15-$0.30/bu. under December ’23 corn futures. While there are a number of reasons that this may be the case, most likely these ethanol plants do not have a strong incentive to bid up fall prices at this point given the expectation that corn supply will be ample in the fall. In reality, as farmers become busy with harvest in the fall, these locations will likely have to strengthen their bids to secure the corn they need. Put plainly, I see little incentive for farmers who expect to deliver corn to ethanol plants this fall to lock in basis bids currently being offered at these locations.
The final example that I want to look at is new crop basis at terminals along the Ohio River. Again, the updated Crop Basis Tool allows users to look at corn and soybean basis bids for terminals along the Ohio River given that basis patterns at these locations may look very different as a result of ebbs and flows in export markets. For example, Figure 3 shows the same sort of new crop corn basis expectation for delivery in fall 2023, but looks at Ohio River terminals specifically.
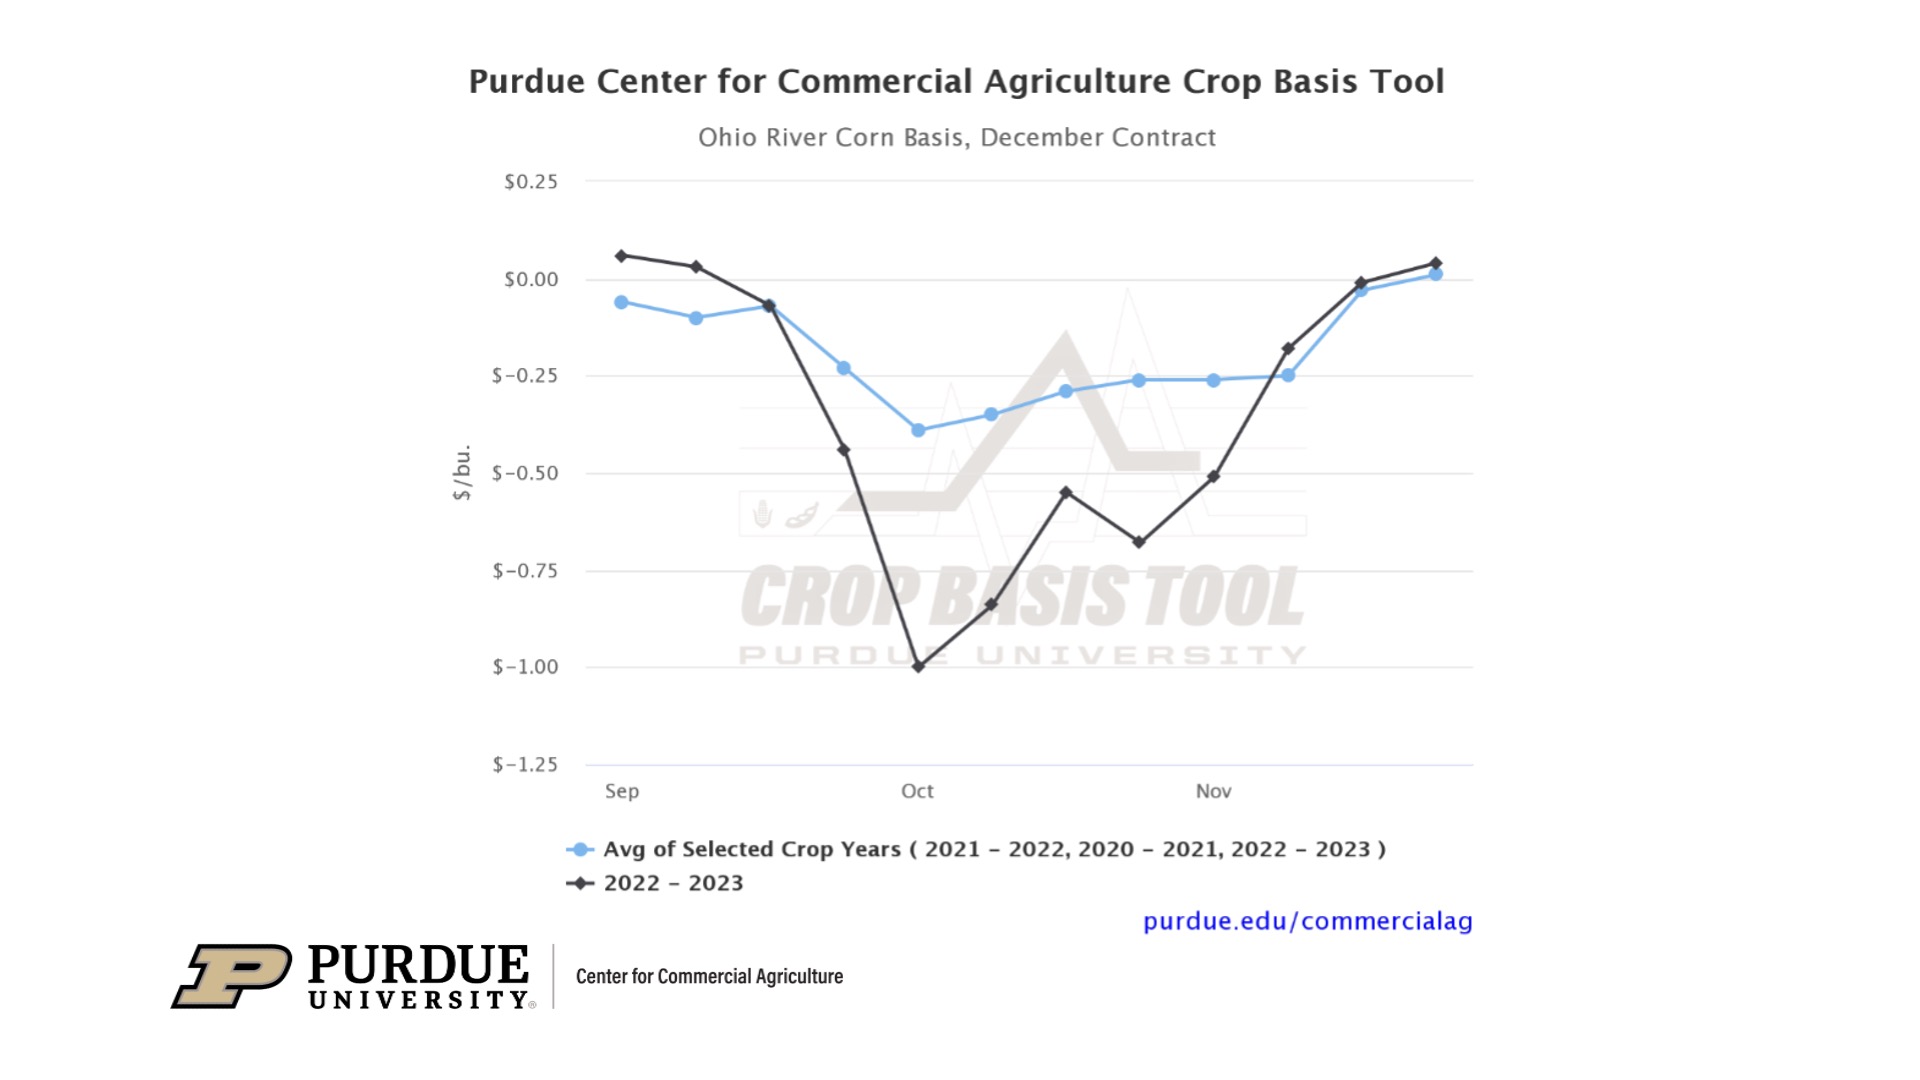
Figure 3. Three-Year Average (2020-2021, 2021-2022, and 2022-2023) Ohio River December Contract Corn Basis as a Forecast of 2023-2024 Corn Basis for Fall Delivery at Ohio River Terminals
As you can see, the basis forecast for delivery of corn in October 2023 at Ohio River terminals is $0.25-$0.40/bu. under December ’23 corn futures. But notice that I left the 2022-2023 basis (the black line on the chart) information on the chart this time. I did this to illustrate how individual years can impact these forecasts. In this particular case you can see the extreme impact that low Mississippi River levels had on basis last fall. This is having a large impact on the basis forecast for fall 2023. Given that I don’t expect a repeat of last fall’s Mississippi River transportation woes, it is probably best to exclude last years values from the historical average. So, instead of adding 2022-2023 to the three-year historical average, I am going to go back to the average of 2019-2020, 2020-2021, and 2021-2022 as the most recent “normal” three years. You can see this in Figure 4.
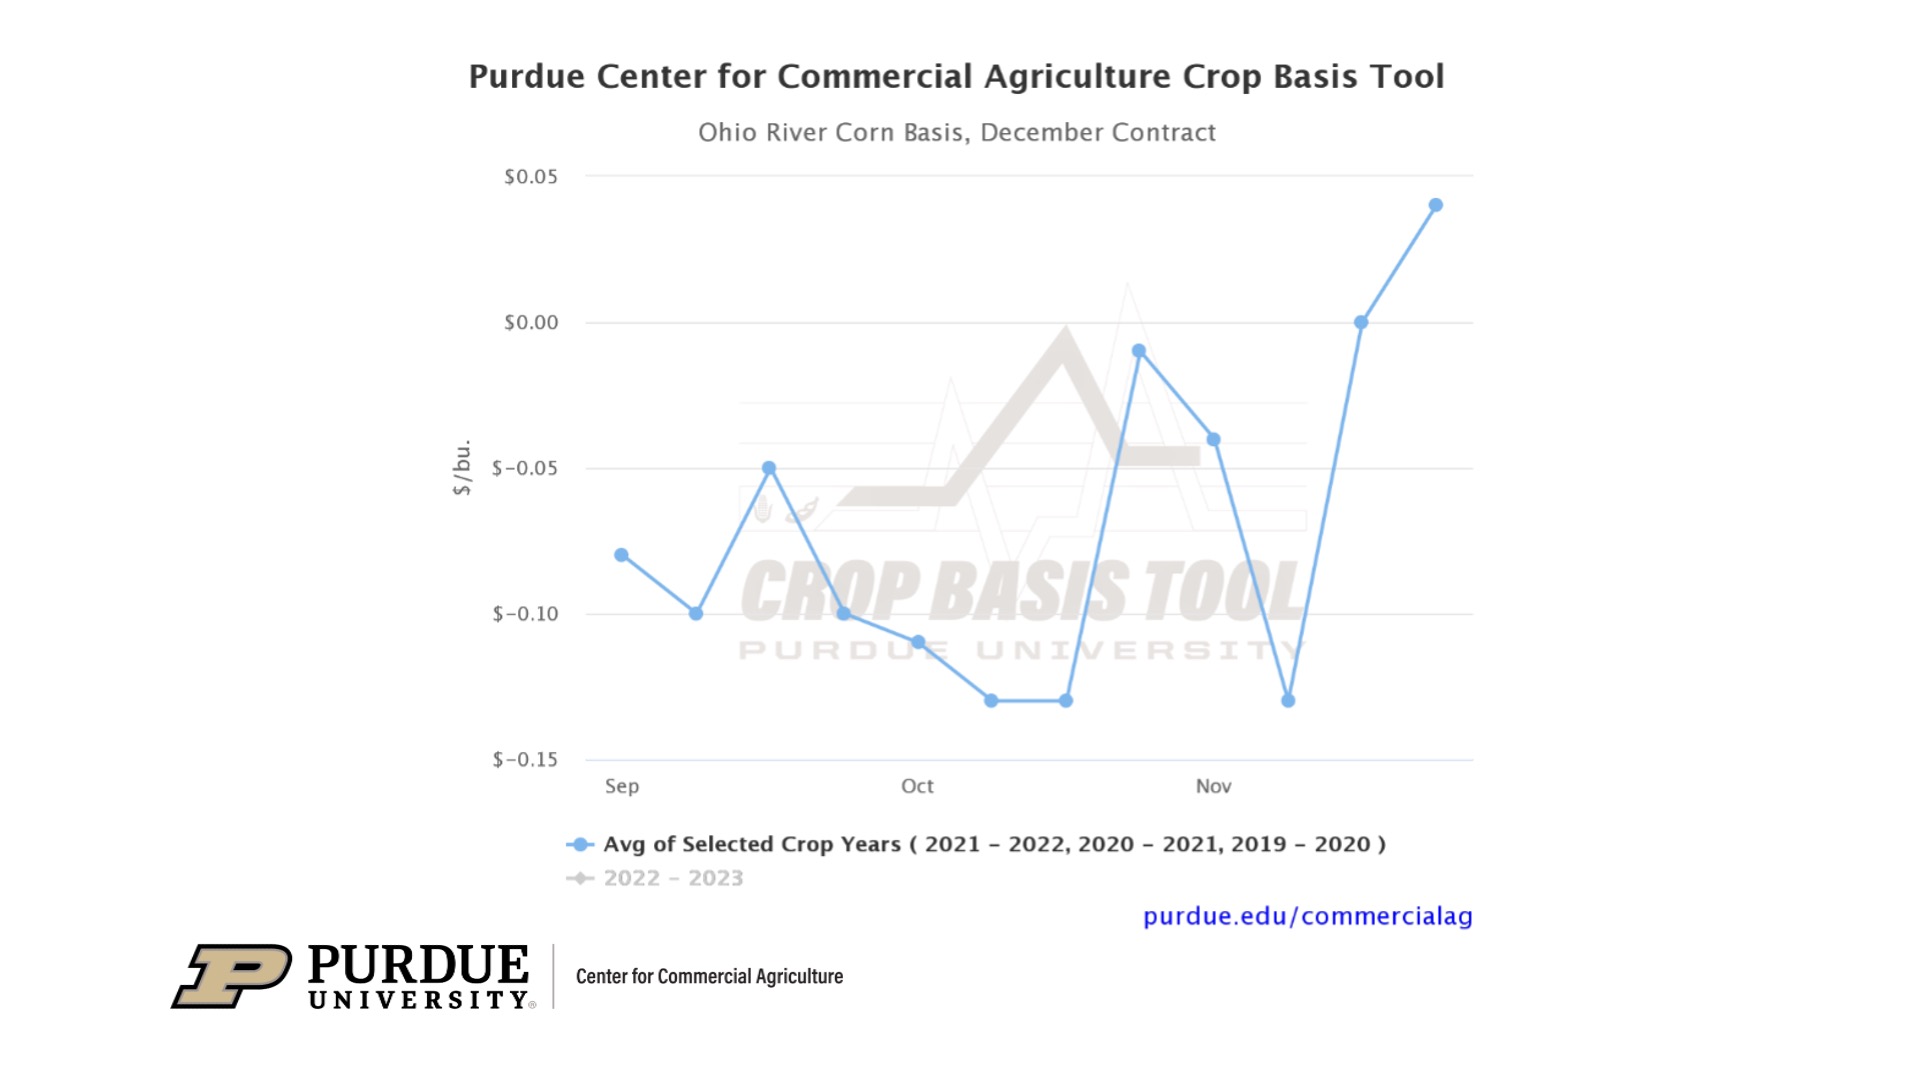
Figure 4. Three-Year Average (2019-2020, 2020-2021, and 2021-2022) Ohio River December Contract Corn Basis as a Forecast of 2023-2024 Corn Basis for Fall Delivery at Ohio River Terminals
As you can see, the basis forecast for delivery in October 2023 at Ohio River terminals when excluding 2022-2023 is $0.05-$0.15/bu. under December ’23 corn futures. This is nearly $0.20-$0.25/bu. stronger than the previous forecast that included 2022-2023. So, how does this compare with current bids at actual terminals along the Ohio River? Interestingly, bids along the Ohio River in southern Indiana are currently weaker than what the historical data would suggest—I have seen recent basis bids for fall delivery at Ohio River terminals ranging from $0.30-$0.40/bu. under December ’23 corn futures. Again, there are several supply and demand factors that may be contributing to this difference. For one, given the expectation of a “normal” production year, there is little reason for these locations to bid up cash prices for fall delivery this far from harvest. Second, and probably of more interest, is that this is likely a reflection of weak export demand that we have seen in the second half of the 2022-2023 crop marketing year. If this weakness in export demand for US corn continues into 2023-2024, you would expect to see this reflected in basis values at terminals along the river where exports are originated.
Conclusion
Users of the Purdue Center for Commercial Agriculture Crop Basis Tool are now able to view new crop basis forecasts for fall delivery by changing the selections within the tool. This article explains how a user would use the Crop Basis Tool to examine new crop basis bids for fall 2023 delivery in central Indiana, at Indiana ethanol plants, and at terminals along the Ohio River, and how these forecasts compare with current forward contract bids. Visit the Purdue Crop Basis Tool to check current corn and soybean basis levels and historical basis trends for your local area.
![]()
![]()
![]()
![]()
![]()
TAGS:
TEAM LINKS:

RELATED RESOURCES
UPCOMING EVENTS
We are taking a short break, but please plan to join us at one of our future programs that is a little farther in the future.