November 9, 2023

November 2023 Corn & Soybean Basis Update

by Nathan Thompson

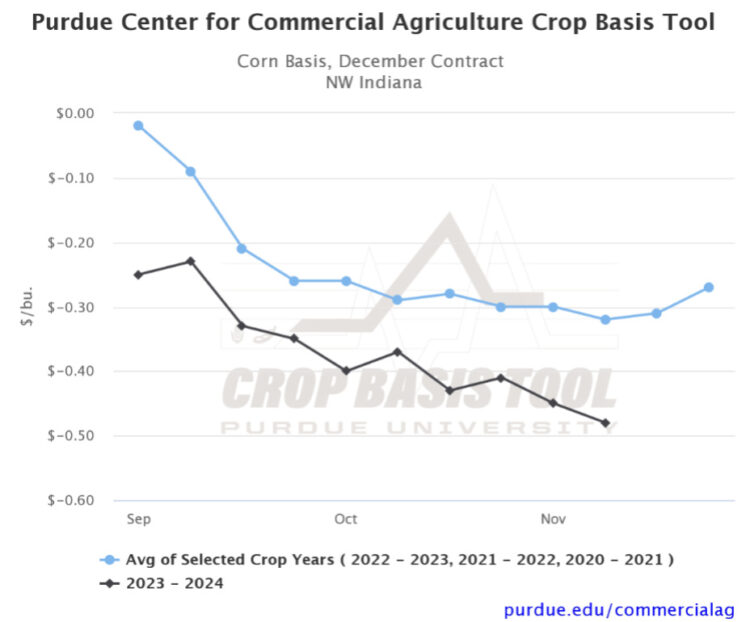
As the calendar turns to November, many farmers in the eastern Corn Belt still have corn left to harvest. According to USDA, 68% of corn in Indiana has been harvested as of November 5th. Wet corn in the primary culprit. As a result, many elevators are full and are at drying capacity. One might expect this to result in weaker basis bids and in some locations it has. For example, corn basis in north west Indiana is $0.48/bu. under Dec. ’23 corn futures, which is $0.16/bu. weaker than the 3-year historical average for the region. However, basis is not the only tool that elevators use to control the flow of grain into the elevator. Many elevators are operating on reduced hours to limit the amount of corn they take in likely limiting basis impacts.

Corn Basis, December Futures for NW Indiana chart, Purdue Commercial Agriculture Crop Basis Tool

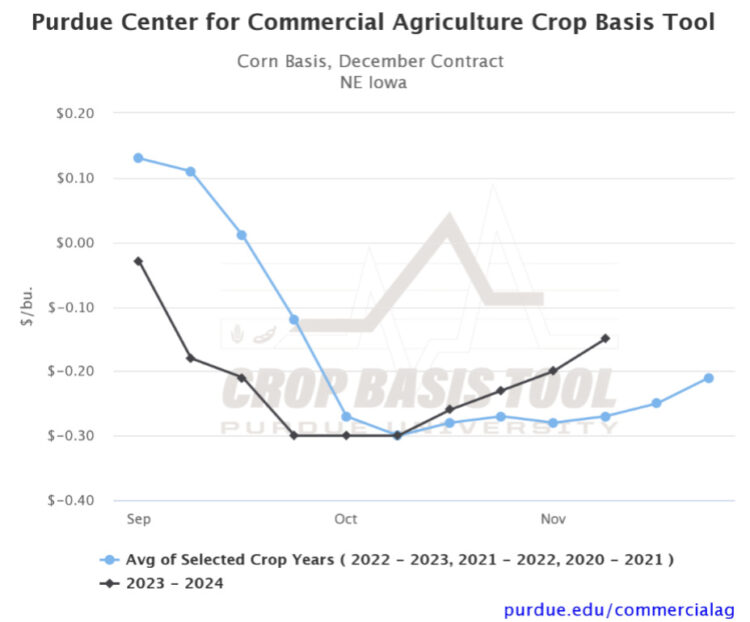
It is interesting to contrast this with what is happening in Illinois and Iowa, where corn harvest is around 90% complete. Corn basis across much of these states has started to strengthen. In particular, regions such as eastern Iowa are experiencing stronger than normal basis due to severe drought in the region during 2023. For example, corn basis in north east Iowa is $0.15/bu. under Dec. ’23 corn futures, which is $0.12/bu. stronger than the 3-year historical average for the region.

Corn Basis, December Futures for NE Iowa chart, Purdue Commercial Agriculture Crop Basis Tool

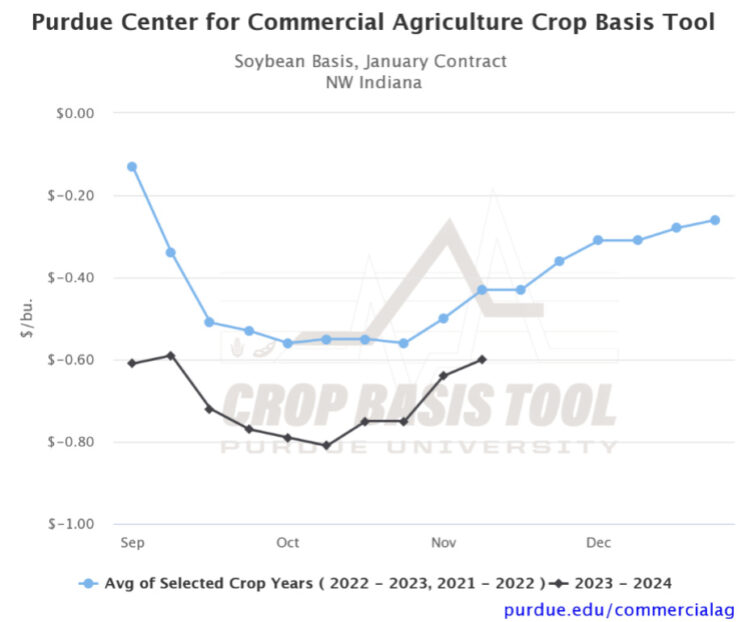
Turning our attention to soybeans, harvest has been much more even, ranging from 87% to 97% complete in Indiana, Illinois, and Iowa as of November 5th. Soybean basis has also been strengthening across the region, especially in the past two weeks. For example, soybean basis in north west Indiana is $0.60/bu. under Jan. ’24 soybean futures. While this $0.17/bu. weaker than the 2-year historical average for the region, this gap has been narrowing in recent weeks. As always, be sure to visit the Purdue Center for Commercial Agriculture Crop Basis Tool to check current corn and soybean basis levels and historical basis trends for your local area.

Soybean Basis, January Futures for NW Indiana chart, Purdue Commercial Agriculture Crop Basis Tool

TAGS:

TEAM LINKS:

RELATED RESOURCES

Corn Basis Continues to Improve as Soybean Basis Varies

June 13, 2025

As July futures near expiration, corn basis across the Eastern Corn Belt continues to strengthen. In Central Ohio, the basis has improved by $0.12/bu over the past three weeks to $0.26/bu, reaching a ten-year high for the second week of June.

READ MORE

Cost Efficiency Comparisons of U.S. and Canadian Farms

May 27, 2025

The objective of this paper is to measure the cost efficiency of corn and soybean production for six typical farms in North America (three in Canada and three in the United States). All these farms produce both corn and soybeans. Cost efficiency is measured using data envelope analysis. In addition to comparing efficiency indices, cost shares of the most efficient farm is compared to cost shares for the other five farms.

READ MORE

Corn and Soybean Basis Go Positive as Strengthening Continues

May 16, 2025

The corn and soybean basis across the Eastern Corn Belt have strengthened for three straight months. As a result of the increasing trend, multiple cash bids across the region are now higher than the July futures price (i.e., basis to July futures is positive). The consistent strengthening has also led to many local basis levels reaching their highest mark of the 2024 – 2025 marketing year.

READ MORE

UPCOMING EVENTS

We are taking a short break, but please plan to join us at one of our future programs that is a little farther in the future.

2025 Indiana Farm Custom Rates

April 17, 2025

The rates reported in this publication were compiled from questionnaires received from farmers, farm owners, farm custom operators, and professional farm managers in Indiana during the last month of 2024 and the first three months of 2025. Respondents were asked to report custom rates they had either paid or received during the past year.

READ MORE

(Part 1) 2024 Indiana Farmland Values & Market Trends

September 11, 2024

Interested in the latest trends and insights on U.S. & Indiana farmland values? This AgCast episode shares insights from the Farm Sector Balance Sheet, USDA data collection methods, regional variations in land values, and the influences of factors such as interest rates and development pressures on farmland prices. Gain an in-depth understanding of trends, market dynamics, and future expectations for farmland values.

READ MORE

August 2024 PAER issue: Farmland Prices Increase Despite Downward Pressure

August 9, 2024

Indiana farmland prices have continued the trend of record highs in 2024, according to the latest Purdue Farmland Value and Cash Rent Survey. The average price of top-quality farmland reached $14,392 per acre, a 4.8% increase from June 2023. Average and poor-quality farmland also saw gains, with prices increasing 3.7% and 4.4% to $11,630 and $9,071 per acre, respectively.

READ MORE