February 12, 2024
Corn & Soybean Basis Steady to Stronger in Most Locations, Weaker at Ohio River Terminals
by Nathanael Thompson
![]()
![]()
![]()
![]()
![]()
After starting the year weaker than normal, corn and soybean basis has been steadily increasing since harvest ended last fall. In recent weeks, many eastern Corn Belt locations have seen steady to slightly stronger corn and soybean basis levels. For example, corn basis in central Indiana for the first week of February was $0.17/bu. under March ’24 corn futures (Figure 1). This is just $0.01/bu. stronger than the last week of January, but is $0.52/bu. stronger than the third week of November. Notice that while corn basis has strengthened considerably since last fall, current basis levels in central Indiana are still about $0.10/bu. weaker than the historical 3-year average basis for the region.
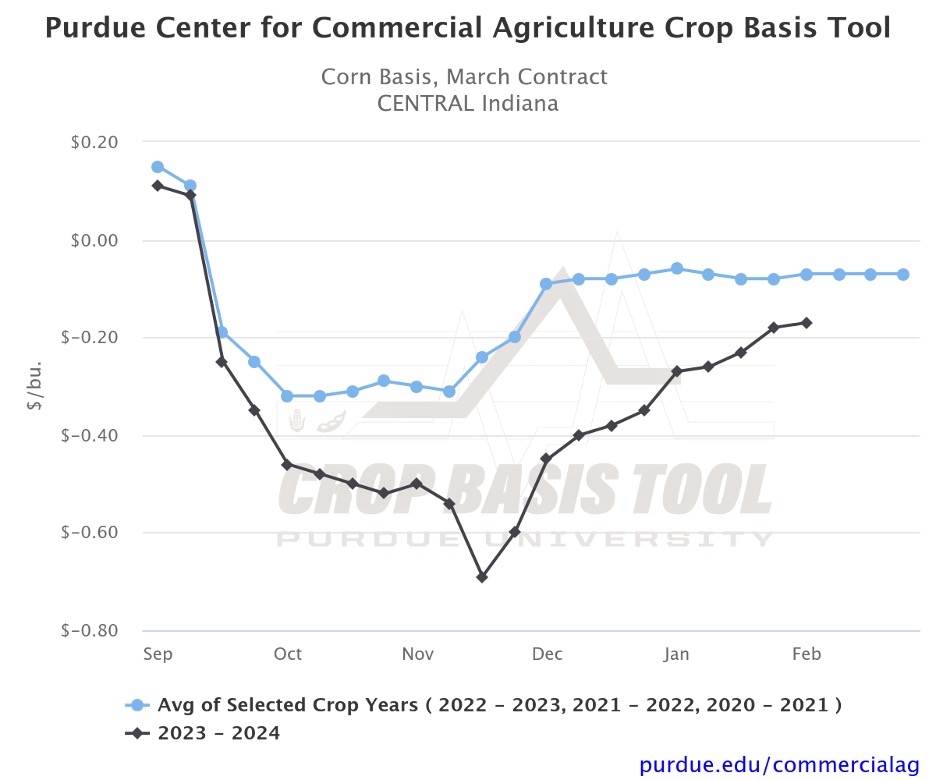
Figure 1. Corn Basis, March Contract for Central Indiana
Source: Purdue Center for Commercial Agriculture Crop Basis Tool
Soybean basis in central Indiana for the first week of February was $0.18/bu. under March ’24 soybean futures (Figure 2). Again, this is just $0.01/bu. stronger than the last week of January, but is $0.71/bu. stronger than the first week of October. Notice that unlike corn, current soybean basis levels in central Indiana are nearly identical to the historical 2-year average for the region and have been for the past several weeks.
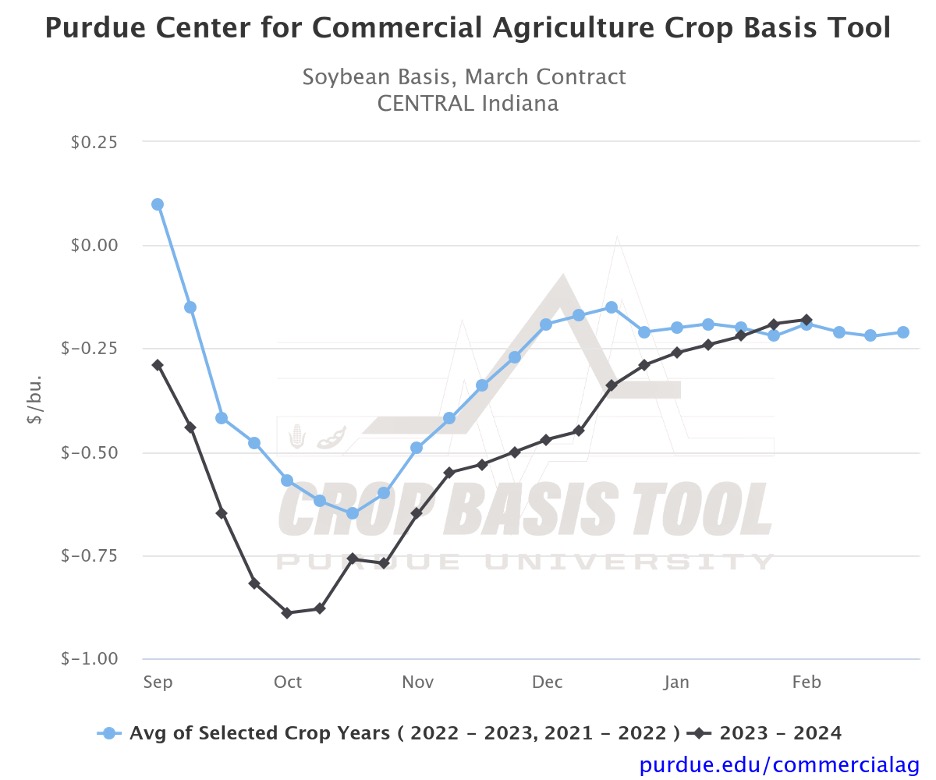
Figure 2. Soybean Basis, March Contract for Central Indiana
Source: Purdue Center for Commercial Agriculture Crop Basis Tool
While the corn and soybean basis patterns described above for central Indiana are generally true for many locations across the eastern Corn Belt, terminals along the Ohio River actually saw corn and soybean basis weaken the first week of February. For example, corn basis at Ohio River terminals for the first week of February was $0.12/bu. under March ’24 corn futures (Figure 3). This is $0.13/bu. weaker than the last week of January. Soybean basis at these river terminals saw a similar decline, with current basis levels for the first week of February being $0.03/bu. under March ’24 soybean futures, or $0.10/bu. weaker than the last week of January (Figure 4).
While there are many things that can impact basis levels at these river terminals, in part these values serve as a proxy for export demand given the river serves as the largest US export channel for corn and soybeans. Therefore, it is not uncommon for basis levels, especially soybean basis, at these locations to stall this time of year when Brazilian soybeans are flooding the international market. However, declines of the magnitude reported above are not typical. It is also important to note that basis values for the first week of February reported here reflect conditions on February 7, 2024, before CONAB and USDA adjustments to Brazilian production on February 8, 2024. It will be interesting to see how corn and soybean basis at these river terminals respond in the coming weeks to cuts in Brazilian corn and soybean production that happened on February 8, 2024 reports. As always, be sure to visit the Purdue Center for Commercial Agriculture Crop Basis Tool to check current corn and soybean basis levels and historical basis trends in your local area.
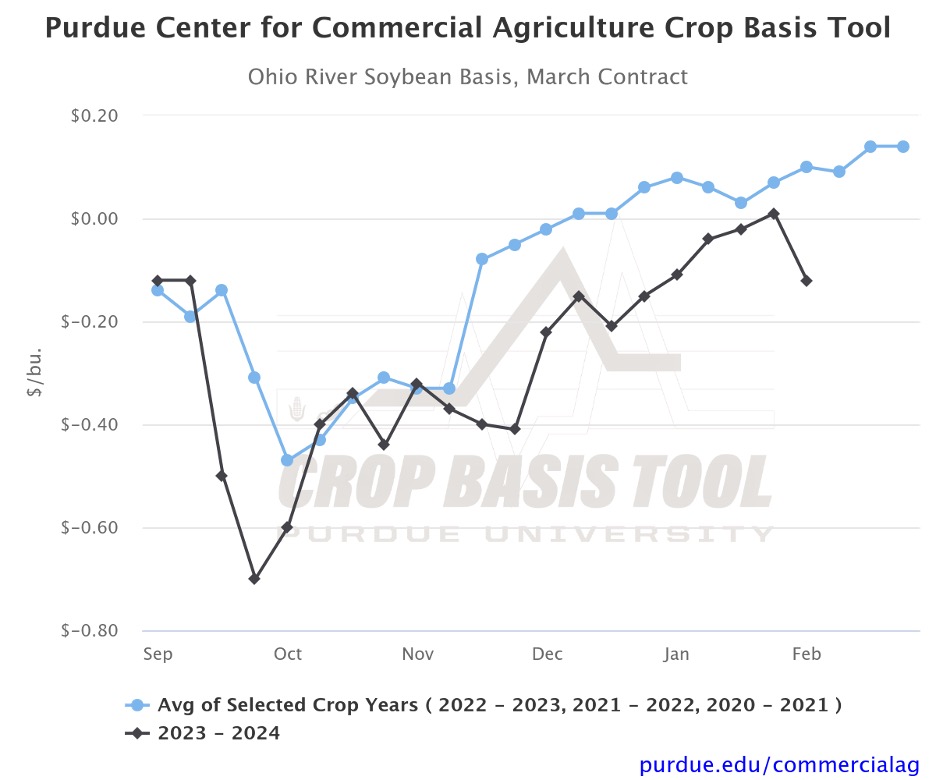
Figure 3. Ohio River Soybean Basis, March Contract
Source: Purdue Center for Commercial Agriculture Crop Basis Tool
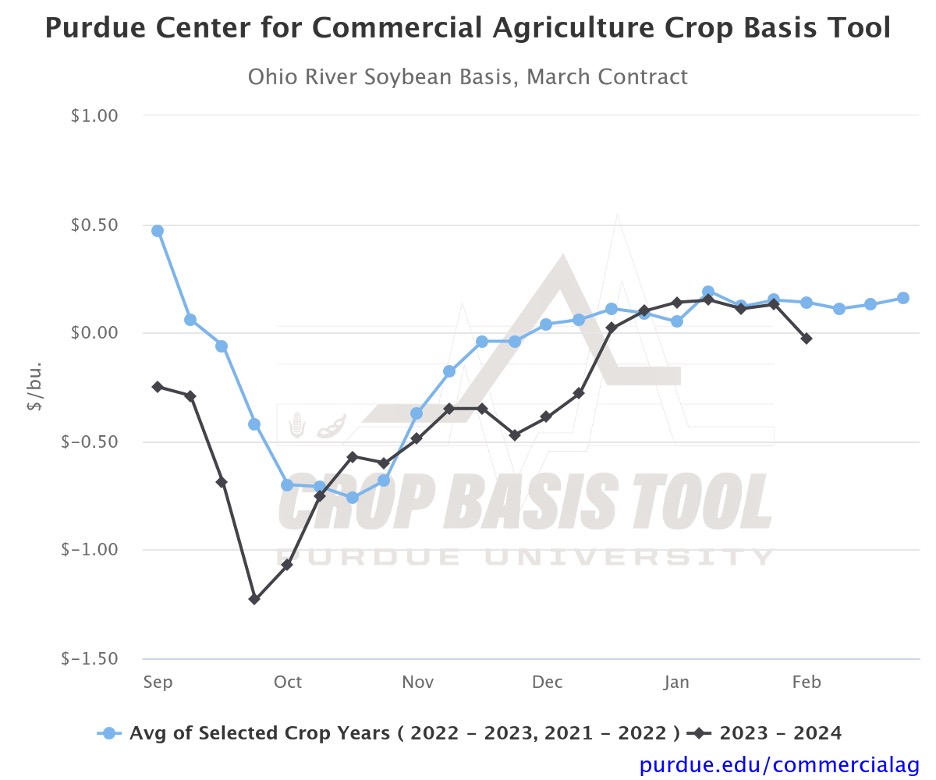
Figure 4. Ohio River Soybean Basis, March Contract 2020-2023
Source: Purdue Center for Commercial Agriculture Crop Basis Tool
![]()
![]()
![]()
![]()
![]()
TAGS:
TEAM LINKS:

RELATED RESOURCES
UPCOMING EVENTS
We are taking a short break, but please plan to join us at one of our future programs that is a little farther in the future.