April 17, 2025
Trends of Increasing Basis Continue Across the Eastern Corn Belt
by Josh Strine
![]()
![]()
![]()
![]()
![]()
Strengthening corn and soybean basis levels have been observed across the Eastern Corn Belt for the second straight month. Historically, the basis had exhibited limited movement or slight weakening from February to April. As a result, the gap between the current basis and the historical average has decreased over the past few months, and in many cases, the 2024 – 2025 basis is now higher than the three (two) year trends for corn (soybeans). As a result of the recent strengthening, many terminal elevators, including ethanol plants and soybean processors, and elevators on the Ohio River now have a positive basis.
Central Indiana corn basis for May futures (Figure 1) provides a snapshot of the trend that can be found across the Eastern Corn Belt. Since the first week of February, the basis has increased by $0.16/bu. to -$0.25/bu. as of April 16th. The three-year average would have suggested only slight strengthening ($0.04/bu.) over the past 10 weeks. The gap between the historical and 2024 – 2025 basis has been cut in half during the time period. Central Indiana soybeans basis for May futures (Figure 2) demonstrates more extreme strengthening over the past two months. The region’s soybean basis has increased by $0.29/bu. over the past two months to -$0.04/bu. The current basis is now greater than the two-year average due to the recent strengthening. As a result of recent strengthening, many districts are experiencing the highest basis levels of the marketing year.

Figure 1. Corn Basis, May Contract for Central Illinois
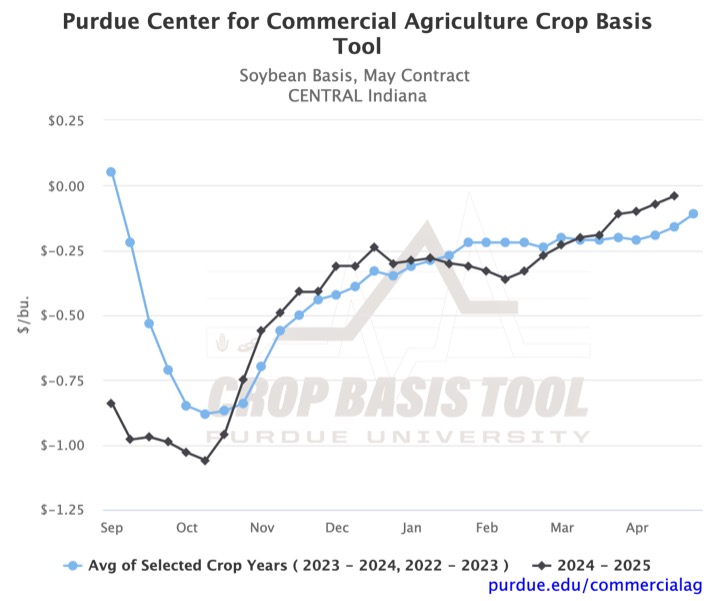
Figure 2. Soybean Basis, May Contract for Central Illinois
Cash prices at the Ohio River are now greater than May futures prices following increases over the past two months (Figures 3 and 4). As of April 16th, the corn basis was $0.14/bu., and the soybean basis was $0.13/bu. Similar trends can be seen in several state-level ethanol and soybean processor basis levels. Based on current basis levels, corn has a greater price premium at the river in Indiana and Illinois, while ethanol plants pay a higher premium in Illinois. On the other hand, soybean processors aggregated at the state level are paying more than delivery points on the river in Illinois, Indiana, and Ohio.
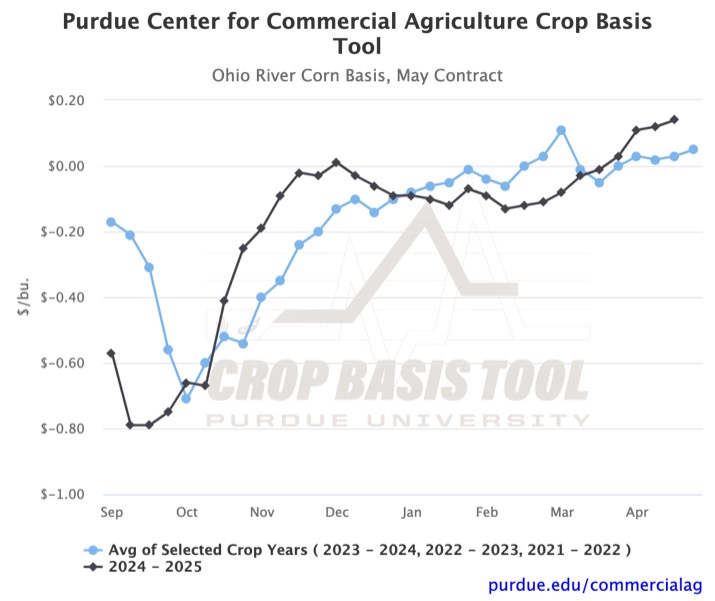
Figure 3. Ohio River Corn Basis, May Contract
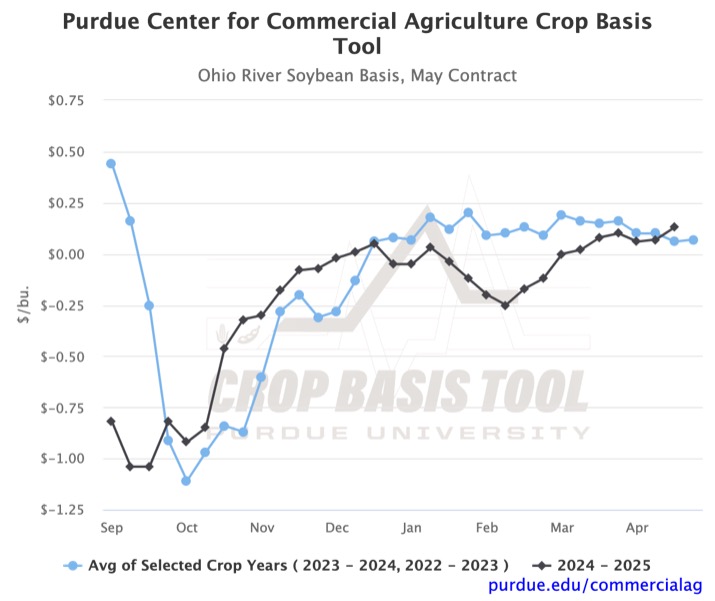
Figure 4. Ohio River Soybean Basis, May Contract
Looking ahead, historical trends suggest the basis may continue to increase slightly or level off over the next one to two months. Weekly basis to July contracts have peaked in May or June over the past two to three years. In regions or markets where the basis is below the historical average, greater strengthening would be required to converge to the historical average. On the other hand, strengthening may be dampened in regions where the 2024 – 2025 basis is above the historical average. To view your local crop basis, check out the Purdue Center for Commercial Agriculture Crop Basis Tool.
![]()
![]()
![]()
![]()
![]()
TAGS:
TEAM LINKS:

RELATED RESOURCES
UPCOMING EVENTS
We are taking a short break, but please plan to join us at one of our future programs that is a little farther in the future.