May 23, 2025
Net Return Comparisons between Tillage Systems
by Michael Langemeier and Yufei You
Conventional tillage patterns and mechanization may lead to increased soil erosion. In contrast, conservation tillage practices, such as no-till and reduced tillage help reduce soil erosion and improve water conservation, contributing to a more sustainable agriculture (Bergtold and Sailus, 2020). Economically and socially, conservation tillage may lower production costs and can enhance crop yields and revenue. Numerous farmers are transitioning from conventional tillage to conservation tillage systems. These shifts towards conservation tillage are driven by both economic and environmental motivations, as these practices can potentially lower input costs and improve long-run productivity.
Despite potential benefits, the adoption of conservation tillage methods is not always an upward linear trend. Plastina and Sawadgo (2021) documented the non-permanence of cover crop and no-till adoption. Between 2012 and 2017, 11% and 33% of the counties in Iowa, Illinois, and Indiana disadopted cover crops and no-till, respectively. In a related study, Sawadgo and Plastina (2022) indicated that 13% of counties in the Heartland region disadopted cover crops while 37% disadopted no-till. For the entire U.S., the disadoption rate related to cover crops (no-till) was higher (lower) than the rate in the Heartland region. Disadoption suggests that the conservations systems did not always perform as expected over time.
Net return comparisons from crop producers that have already adopted certain practices can be used to gauge the performance of conservation systems before adoption. This article compares the net return per acre for no-till systems and reduced tillage systems for corn and soybeans during the last ten years. FINBIN data from 2014 to 2023 for corn and soybean enterprises were utilized in this study. To ease comparisons, individual cost items were aggregated into five categories: direct costs, power costs, overhead costs, land rent, and labor and management charge (i.e., operator and family labor). Direct costs included seed, fertilizer, crop chemicals, crop insurance, drying, and storage. Power costs included fuel and oil, repairs, custom hire, machinery leases, utilities, hauling and trucking, and machinery and building depreciation. Overhead costs included hired labor, marketing, building leases, property taxes, farm insurance, dues and professional fees, interest, and miscellaneous expense. In the FINBIN database, tillage systems are broken down into several categories including moldboard, chisel/reduced, minimum till, no-till, ridge till, and strip till. Data were more plentiful for the chisel/reduced and no-till systems, thus the focus on these two systems in this paper. The chisel/reduced tillage system will be referred to as the “reduced tillage” system in the discussion below.
Literature Review
Langemeier (2010) examined the relative technical and cost efficiency of no-till farms in central Kansas. Data from the Kansas Farm Management Association (KFMA) for farms that had adopted no-till production systems and for farms with conventional or reduced tillage systems (referred to as mixed tillage systems in the paper) were used in the study. Technical efficiency, which focuses on production per unit of input, was not significantly different between the two groups of farms. However, cost efficiency, which measures a farm’s ability to produce a given level of output for the lowest cost per unit, was significantly higher for the no-till farms. Income and cost shares for the no-till farms and mixed tillage farms were also compared. The no-till farms produced more feed grains and oilseeds, and less small grains than the mixed tillage farms. The cost share for chemicals was higher and the cost shares for labor and capital were lower for the no-till farms.
When examining the benefits associated with conservation practices, it is important to have a long-run view. Bergtold and Sailus (2020) indicated that conservation tillage practices often lead to short-run yield reductions, which may or may not be offset by short-run cost savings. Moreover, Cusser et al. (2020) noted that consistent benefits of no-till practices emerge after more than a decade of implementation. Given this, there may be differences between a short-run benefit/cost analysis and a long-run benefit/cost analysis. As with potential risk benefits, to properly analyze the benefits of conservation practices requires a long-run analysis.
It is often difficult to obtain data pertaining to conservation practices that includes both environmental and economic computations. The Precision Conservation Management (PCM) non-profit was created to evaluate in-field conservation decisions in Illinois. Using data for corn production from 2015 to 2023; no-till, 1-pass light, 2-pass light, and 2-pass moderate production systems had average operator and land returns ranging from $355 to $367 per acre. Average returns for a strip till and 2+ tillage pass systems were substantially lower. The no-till and strip till production systems exhibited lower erosion levels and had lower GHG emissions than the other systems. The relative environmental benefits for no-till soybeans were similar to no-till corn. However, operator and land return for no-till soybeans was approximately $20 per acre lower than the returns for the 1-pass light, 2-pass light, and 2-pass moderate production systems. Obviously, there is a tradeoff between returns and environmental benefits for soybeans, which again points to the importance of examining long-run benefits and costs rather than focusing on short-run benefits and costs.
Net Return Comparisons
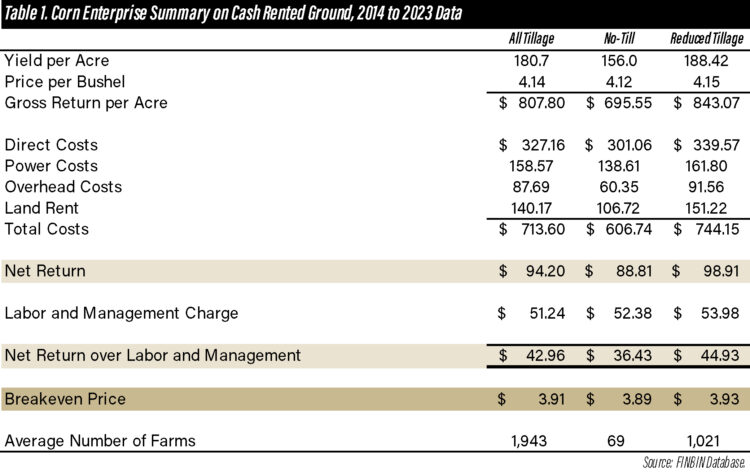
Table 1 summarizes cost and return per acre for corn enterprises for the all-tillage category and for enterprises categorized as no-till and reduced tillage. The all-tillage column is included as a point of reference. Comparisons will focus on the second and third columns. Given the large yield and land rent differences between the no-till and reduced tillage systems, it is likely that the no-till systems were utilized on lower quality soils. The PCM summary for the 2015 to 2023 period showed a yield difference between the no-till and the 2-pass light system (the most profitable system) of 8 bushels per acre or 3.5 percent. Despite the fact that the tillage systems were likely utilized on different quality land, comparisons are still useful for two reasons. First, land rent typically adjusts across regions to account for land quality. Second, even though production conditions vary across regions, corn farms compete with both farms inside and outside their region.
The sum for each cost category in table 1 for the no-till system was lower than that for the reduced tillage system. Though not shown in table 1, crop chemical cost was $2 per acre higher for the no-till system, while fuel and oil, repairs, and machinery and building depreciation were from $5 to $10 per acre lower for the no-till system when compared to the reduced tillage system. These results are consistent with Langemeier (2010) who found that the cost share for chemicals (capital) was higher (lower) for no-till farms in central Kansas. Also, the PCM summary for 2015 to 2023 indicated a reduction of approximately $20 per acre in power costs for no-till corn. The net return over labor and management per acre for the no-till corn enterprise was $6.50 per acre lower (approximately 19 percent lower) than the net return per acre for corn produced using the reduced tillage system.
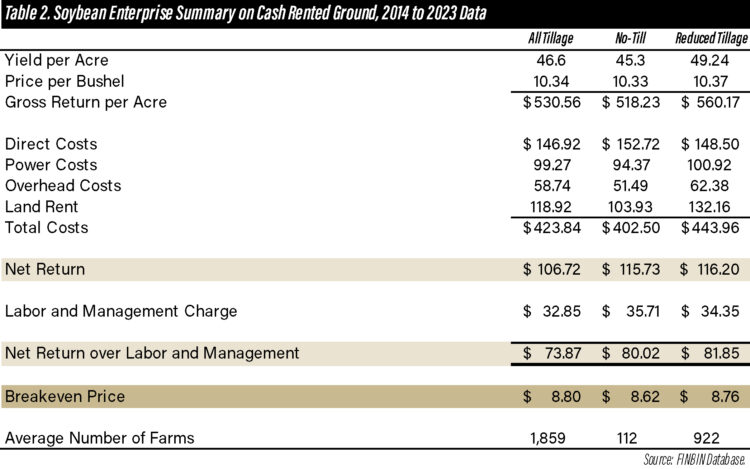
A summary of no-till and reduced tillage systems for soybean enterprises using data from 2014 to 2023 can be found in table 2. The yield for soybeans in the no-till system was lower than the yield in the reduced tillage system. However, the percentage difference was not near as large for soybeans as it was corn. Using the PCM summary of results for the 2015 to 2023 period, soybean yields in Illinois were 2 bushels per acre lower (2.9 percent) for no-till soybeans compared to the 2-pass moderate system (the most profitable production system).
Direct cost per acre was slightly higher for the no-till system while the other major costs per acre were lower for this system. Using the PCM summary results, direct cost per acre for the no-till soybean enterprises was similar to the direct cost per acre for the 2-pass moderate system, but power costs were $21 per acre lower. Net returns over labor and management per acre between the no-till and reduced tillage systems were very similar.
Concluding Comments
Using the FINBIN database, this article compares the net return per acre between no-till systems and reduced tillage systems for corn and soybeans from 2014 to 2023. Net return over labor and management for the no-till system was $6 per acre lower for corn and $2 per acre lower for soybeans than that for the reduced tillage system. It is important to keep in mind, however, that no-till systems typically exhibit lower erosion levels and GHG emissions. Thus, there is a tradeoff between net return per acre and environmental concerns that need to be considered when comparing these two production systems. Data limitations precluded a comparison of variability of net returns or downside risk between the two production systems. It is certainly plausible to expect the no-till system to reduce yield risk, particularly in the western Corn Belt where lack of rainfall serves as a serious check on crop yields in some years.
Citations
Bergtold, J. and M. Sailus, editors. Tillage Systems in the Southeast: Production, Profitability, and Stewardship. SARE Handbook Series 15, 2020.
Center for Farm Financial Management, University of Minnesota, FINBIN web site, accessed April 23, 2025.
Cusser, S., C. Bahlai, S.M. Swinton, G.P. Robertson, and N.M. Haddad. “Long-Term Research Avoid Spurious and Misleading Trends in Sustainability Attributes of No-Till.” Global Change Biology. 26(2020):3715-3725.
Langemeier, M. “Relative Technical and Cost Efficiency of No-Till Farms.” Journal of International Farm Management. 5(April 2010):1-11.
Plastina, A. and W. Sawadgo. “Cover Crops and No-till in the I-States.” Agricultural Policy Review, Fall 2021, Center for Rural Development, Iowa State University.
Precision Conservation Management. “The Business Case for Conservation, 2015-2023 Data Summery,” July 2024.
Sawadgo, W. and A. Plastina. “The Invisible Elephant: Disadoption of Conservation Practices in the United States.” Choices. 37(Quarter 1, 2022):1-13.
TAGS:
TEAM LINKS:
RELATED RESOURCES
UPCOMING EVENTS
January 27 or 28, 2026
Farm Shield is more than a conference, it’s a commitment to helping agricultural families build resilience and plan for a secure future. Don’t miss this opportunity to protect your legacy!
Read MoreJanuary 9, 2026
A management programs geared specifically for farmers. Surrounded by farm management, farm policy, agricultural finance and marketing experts, and a group of your peers, the conference will stimulate your thinking about agriculture’s future and how you can position your farm to be successful in the years ahead.
Read More

