February 13, 2015
Measuring Risk and Uncertainty
![]()
![]()
![]()
![]()
![]()
As noted in the first article in this series, risk represents a situation in which probability information is available. With probability information, it is possible to create a distribution of outcomes, and more importantly use common risk measures such as variability and downside risk. Uncertainty represents a situation in which probability information is not available. Under uncertainty, it is possible to list possible outcomes, but information on the probability of each outcome is not available.
One of the first steps to measuring risk is to create a distribution of possible outcomes. Figure 1 illustrates the distribution of the real contribution margin per acre for a corn/soybean rotation for a case farm in west central Indiana. The figure uses data from 1996 to 2014. The data for each year is reported in table 1. The contribution margin is computed by subtracting variable costs from gross revenue. Nominal values were converted to real 2014 dollars using the implicit price deflator for personal consumption expenditures. The extremes in figure 1 (223 on the low side and 449 on the high side) were computed by subtracting and adding one standard deviation from the average value of 336. The distribution of contribution margins in figure 1 has quite a bit of weight below the average of 336. Specifically, 12 of the 19 values are below 336. Three of these values are below the average minus one standard deviation (2003, 2004, and 2005). Five of the seven values above 336 are more than one standard deviation above the average. Years included in this category are 2007, and 2010 through 2013.
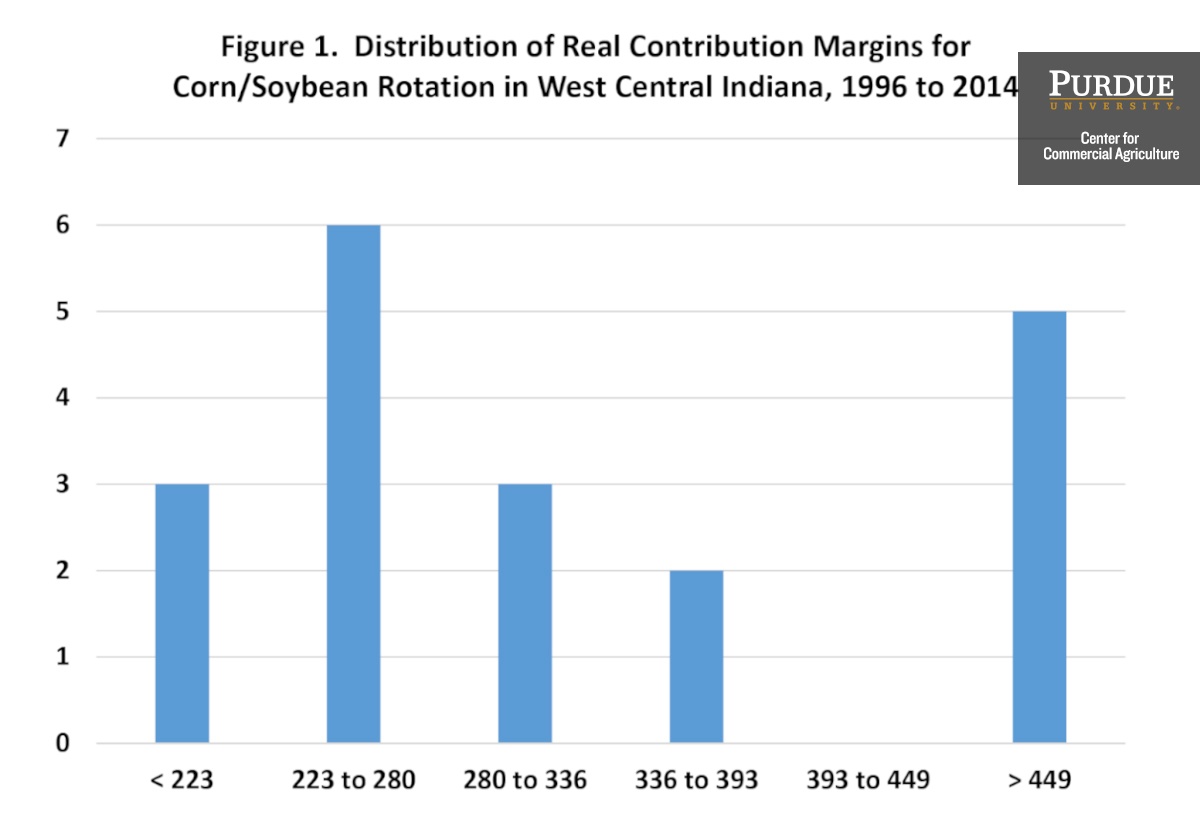
Figure 1. Distribution of Real Contribution Margins for Corn/Soybean Rotation in West Central Indiana, 1996 to 2014
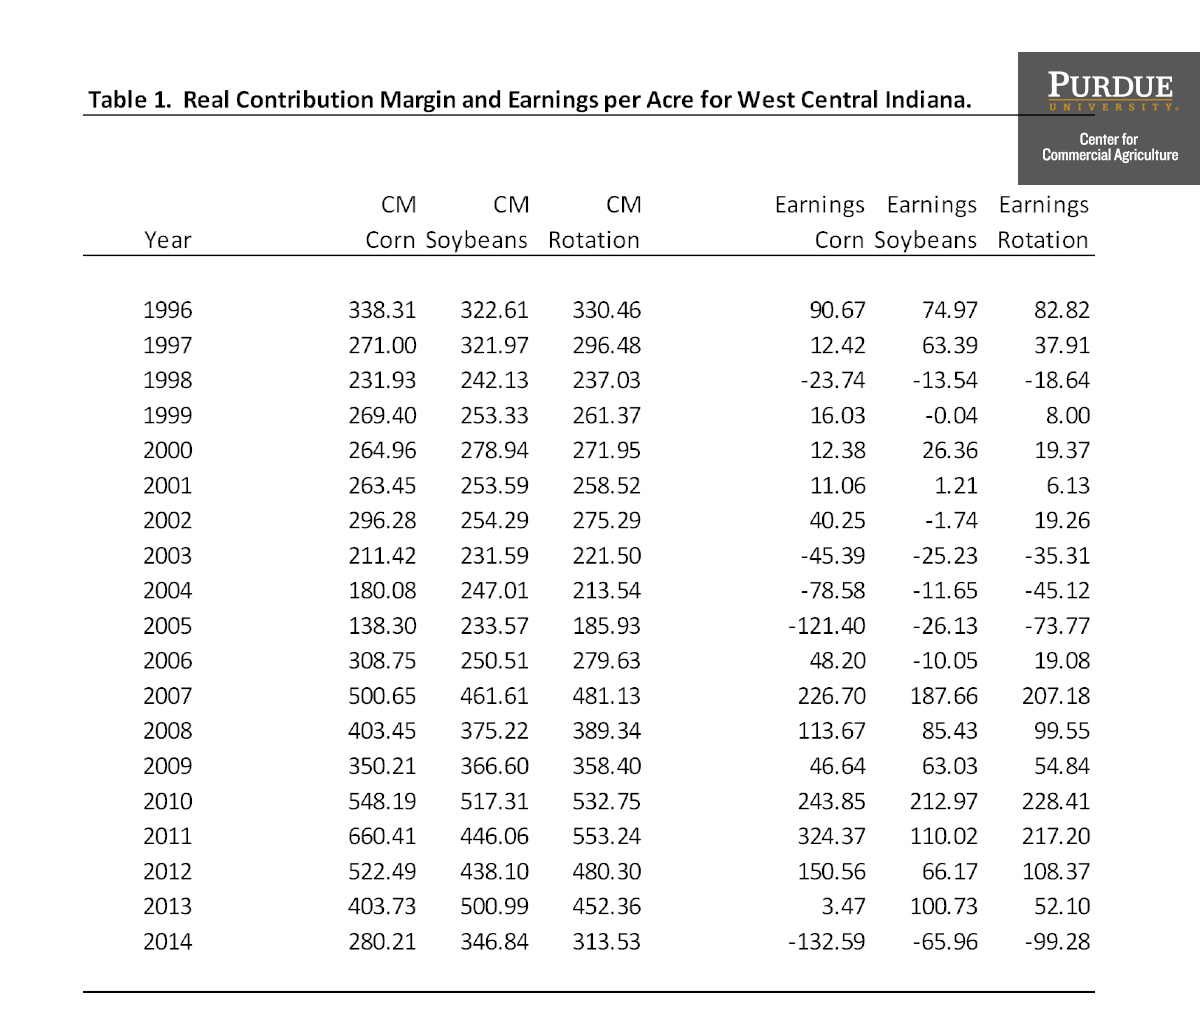
Table 1. Real Contribution Margin and Earnings per Acre for West Central Indiana
One of the most commonly used risk measures is variability. The variance or standard deviation of a set of outcomes (e.g., corn/soybean contribution margins) measures the possible dispersion of outcomes. A higher standard deviation represents a higher level of risk. Table 2 illustrates the average and standard deviation of the real contribution margin per acre and real earnings per acre for corn, soybeans, and a corn/soybean rotation for a case farm in west central Indiana. The table uses the data from 1996 to 2014 reported in table 1. Earnings per acre are computed by subtracting variable and overhead costs from gross revenue. Overhead costs include opportunity costs on operator labor, machinery costs, and land costs. Over the long-run, earnings per acre will migrate towards zero. The average and standard deviations reported in table 2 are computed using the following EXCEL functions: “average” and “stdev”. The standard deviation of the contribution margin and earnings for corn is relatively higher than the standard deviation of the contribution margin and earnings for soybeans and the rotation. Thus, using this data, corn is relatively more risky than either soybeans or the rotation.
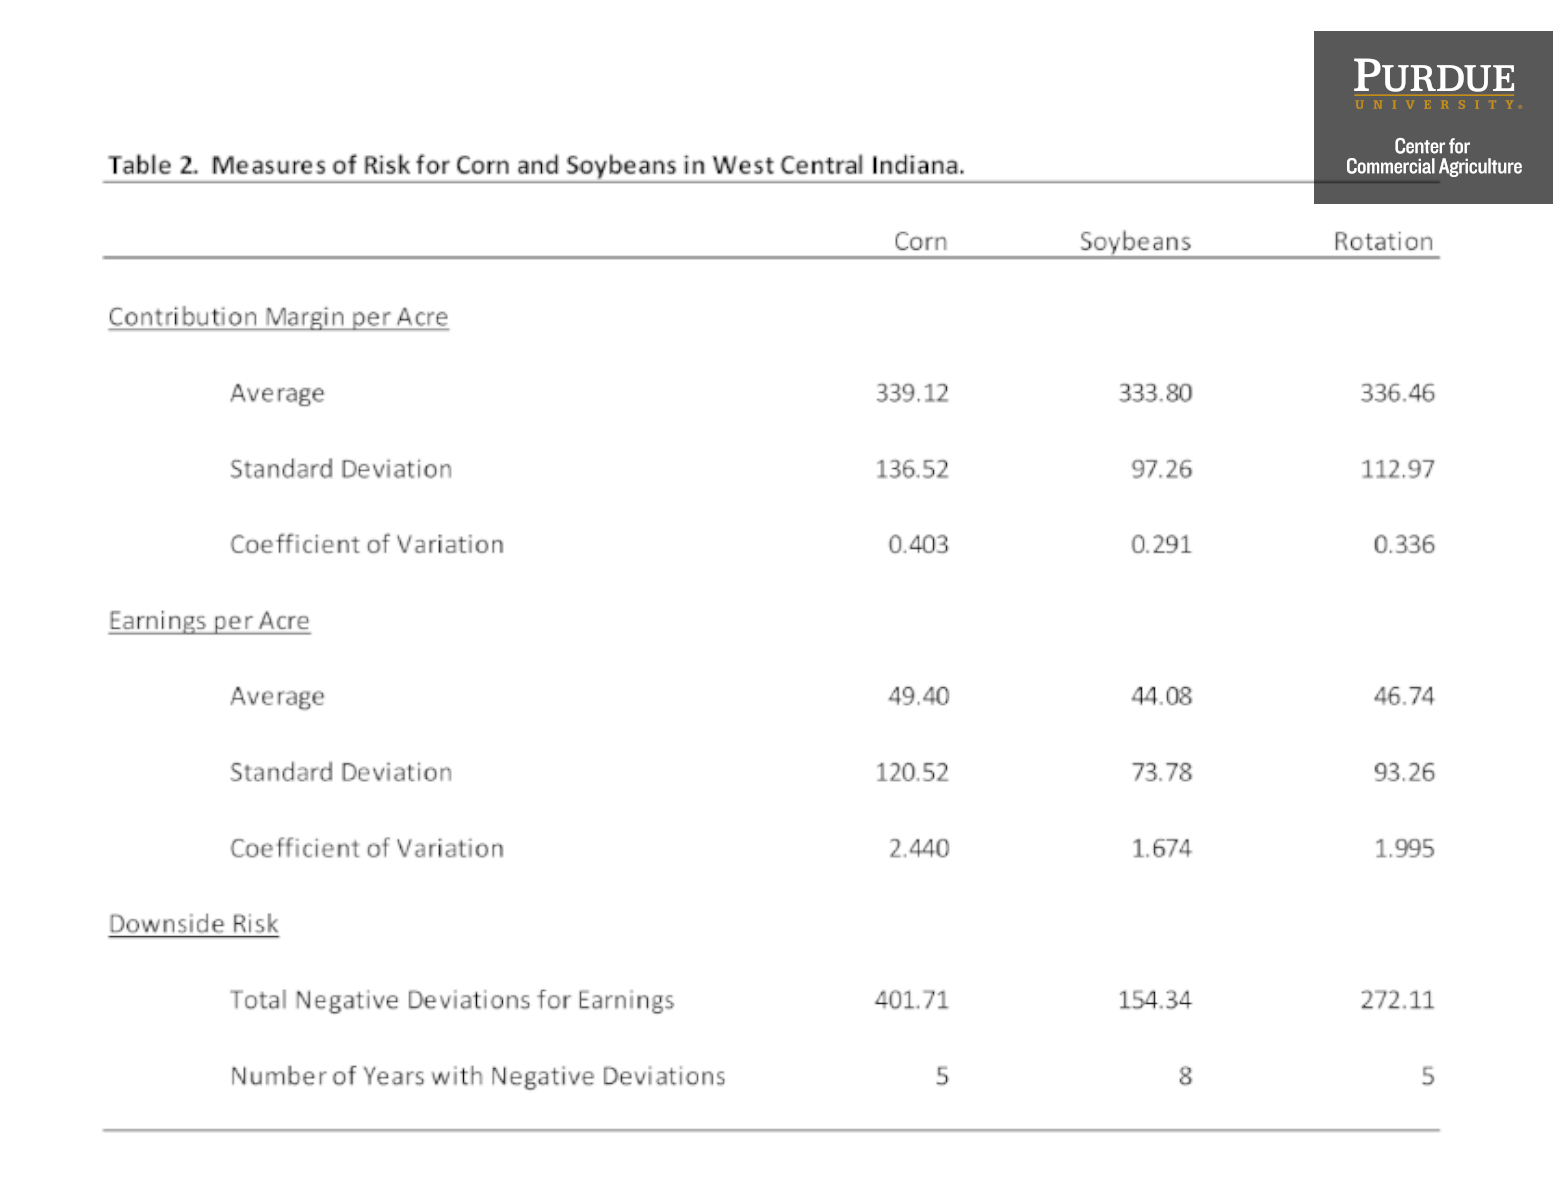
Table 2. Measures of Risk for Corn and Soybeans in West Central Indiana
Table 2 also reports the coefficient of variation for corn, soybeans, and the corn/soybean rotation. The coefficient of variation is a relative risk measure and is computed by dividing the average by the standard deviation. A larger coefficient of variation reflects more risk. Using the coefficient of variation, corn is relatively more risky. Another common method used to measure risk is to compute downside risk which can be measured either as the number of years for which returns are below a target, or the negative deviations from a target. Downside risk is closely related to the term “loss exposure”. Loss exposure represents the amount of capital contributed to an activity a farm could lose. The natural target for earnings per acre is zero. Soybeans exhibited more years from 1996 to 2014 that had negative earnings (i.e., eight years) than corn and the corn/soybean rotation. Negative deviations for corn were greater than $100 in both 2005 ($121) and 2014 ($133). In contrast, the largest negative deviation for soybeans was $66 in 2014. To capture the magnitude of negative deviations, we can add up the negative deviations over the sample period. Total negative deviations, at -$402, were relatively higher for corn. Given this fact, corn appears to be more risky than soybeans.
So far this article has focused on measuring risk. With uncertainty, one does not have probability information or data pertaining to possible returns. Given this fact, it is not possible to measure uncertainty in the same fashion that we measure risk. In future articles, we will discuss the development of scenarios, which are commonly used when dealing with uncertainty.
This article described two risk measures, variability and downside risk, that are commonly used. Using a case farm in west central Indiana that produced corn and soybeans, variability and downside risk were higher for corn than for soybeans. Thus, corn was more risky over the 1996 to 2014 period. Next month’s article will briefly discuss different types of risk faced by farmers.
![]()
![]()
![]()
![]()
![]()
TEAM LINKS:
PART OF A SERIES:
RELATED RESOURCES
UPCOMING EVENTS
We are taking a short break, but please plan to join us at one of our future programs that is a little farther in the future.