September 23, 2020
Benchmarking Crop Machinery Investment and Cost per Acre
by Michael Langemeier
![]()
![]()
![]()
![]()
![]()
The continued increase in the size of tractors, combines, and other machinery has enabled farms to operate more acres and reduce labor use per acre. However, this increase in machinery size also makes it increasingly important to evaluate the efficient use of machinery. Two commonly used benchmarks to evaluate the efficient use of machinery are machinery investment per acre and machinery cost per acre. This article illustrates the computation of machinery investment and cost for a case farm in west central Indiana and compares these values to machinery investment and cost benchmarks.
Machinery investment per acre is computed by dividing total crop machinery investment (i.e., investment in tractors, combines, and other machinery) by crop acres or harvested acres. In regions where double-cropping is prevalent, using harvested acres gives a more accurate depiction of machinery investment.
Machinery investment per acre typically declines with farm size. It is important for farms to compare machinery investment per acre with similarly sized farms and to examine the trend in this value for a particular farm. A farm with relatively high machinery investment per acre needs to determine whether this high value is a problem. If the farm faces serious labor or timeliness constraints, their machinery investment per acre may be relatively high. However, if their machinery investment per acre is high due to the purchase of assets used to mitigate income tax obligations, the farm needs to think about whether this is a profitable long-term strategy (i.e., is the farm going to exhibit higher costs per acre due to this strategy).
Machinery cost per acre is computed by summing depreciation, interest, property taxes, insurance, building expense, leasing, repairs, fuel and lubricants, and custom hire and rental expense; and dividing the resulting figure by crop acres or harvested acres. Interest should include both cash interest paid and an opportunity charge on machinery and equipment that is owned. Again, in regions where double-cropping predominates, using harvested acres is preferable.
Machinery investment and cost for a case farm is presented in table 1. This case farm has 1500 acres of full-season corn and 1500 acres of full-season soybeans. If this farm had livestock, the relevant machinery investment and cost figures for the livestock operation would need to be excluded from total machinery investment and cost to compute the values in table 1. Machinery investment per acre for this farm is approximately $453. Machinery costs include depreciation, interest, insurance, building expense, repairs, and fuel and lubricant. The depreciation reported in table 1 represents economic depreciation rather than tax depreciation. Economic depreciation is approximated using purchase prices, salvage values, useful life, and straight-line depreciation for each piece of machinery. This farm does not custom hire or lease machinery so the values for these items are zero in table 1. Interest was computed my multiplying machinery investment by a long-term interest rate (6%). Machinery cost per acre for the case farm is approximately $125.
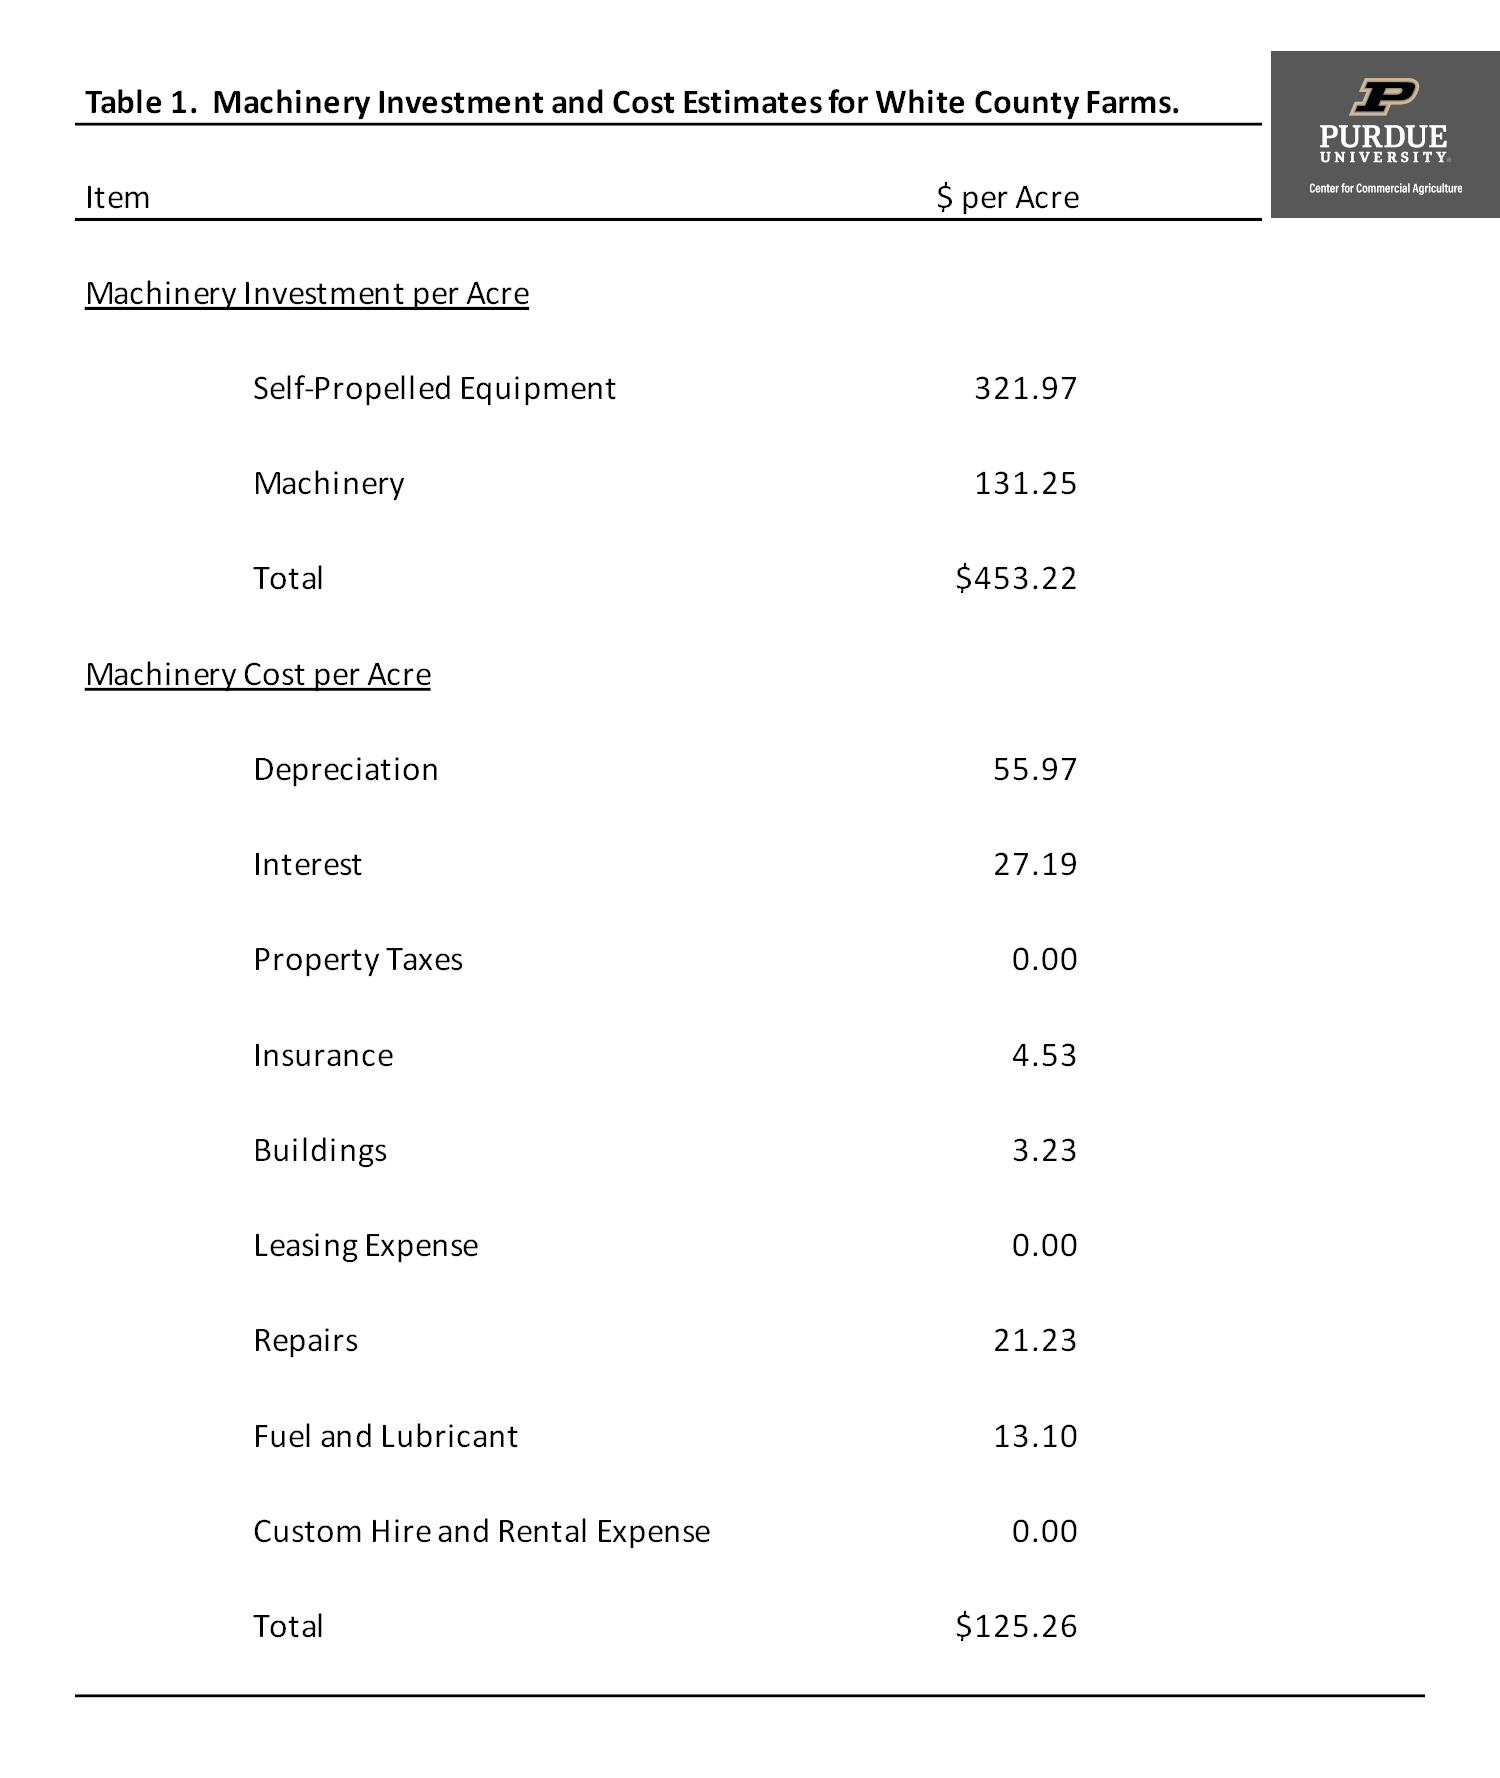
Table 1. Machinery Investment and Cost Estimates for White County Farms.
Unfortunately, crop machinery benchmarks are not readily available. However, some information is available from farm management association programs in Illinois, Kansas, and Minnesota (e.g., Center for Farm Financial Management; Langemeier and Ibendahl). For a farm with 3000 crop acres, machinery investment per acre and machinery cost per acre are typically below $475 and $110 per acre, respectively. The case farm’s value of crop machinery investment is slightly below the benchmark. However, machinery cost per acre is higher than the benchmark. This farm should compare individual cost items to benchmarks, and try to analyze machinery costs per acre for each enterprise.
It is also important to note that this farm has strong labor benchmarks. Given the potential tradeoff between labor cost and machinery cost, it is often important to compute both labor and machinery benchmarks.
This article defined, described, and illustrated the use of crop machinery investment and cost benchmarks for a case farm. The case farm had values that were similar to the benchmark targets. Related articles in this series discuss profitability and financial efficiency benchmarks, repayment capacity benchmarks, and labor benchmarks.
References
Center for Farm Financial Management, University of Minnesota, FINBIN database, accessed September 23, 2020.
Langemeier, M.R. and G. Ibendahl. “Crop Machinery Benchmarks.” Journal of Farm Managers and Rural Appraisers. 77(2014):204-213.
![]()
![]()
![]()
![]()
![]()
TEAM LINKS:

PART OF A SERIES:

RELATED RESOURCES
UPCOMING EVENTS
We are taking a short break, but please plan to join us at one of our future programs that is a little farther in the future.