September 23, 2020
Benchmarking Labor Efficiency and Productivity
by Michael Langemeier
![]()
![]()
![]()
![]()
![]()
It takes a lot of family and hired labor to run modern farms. Labor is an important and costly input and farm managers need to ask if they are getting the efficiency and productivity needed from that labor to be competitive. One way to evaluate this question is to use benchmarks created using data from similar farms. Labor benchmarks should include family and operator labor as well as hired labor. In this article, labor efficiency and productivity measures are illustrated for a case farm in west central Indiana and compared to benchmark targets.
This article focuses on two labor benchmarks: labor efficiency (a cost measure) and labor productivity (an output measure). Labor efficiency is computed by dividing total labor cost (hired labor plus family and operator labor) by gross revenue. Hired labor cost and gross revenue can be found on the farm’s income statement. Family and operator labor can be represented by family withdrawals, which can be found on the farm’s sources and uses of funds statement. The income statement and sources and uses of funds statement were illustrated in previous articles in this series. Labor productivity is computed by dividing gross revenue by the number of workers. If all of the employees, including the operator or operators, are fully employed, it is relatively easy to compute the number of workers. It is relatively more difficult to compute this figure when employing part-time or seasonal workers. If some of the hired labor is seasonal or part-time, the total months worked by all hired and seasonal employees should be summed and then divided by 12 to arrive at the number of workers.
If labor efficiency is relatively high and labor productivity is relatively low, it may indicate that the farm is going to have difficulty supporting all of the farm employees. Timeliness of operations should be incorporated into the evaluation of whether a farm has excess labor. Conversely, if labor efficiency is relatively low and labor productivity is relatively high, it is important to check the efficiency of machinery use. Sometimes a farm will be efficient with respect to labor, but have relatively high machinery benchmarks, or be inefficient with respect to labor, but have relatively low machinery benchmarks. Ideally, a farm would like to be competitive with respect to both labor and machinery.
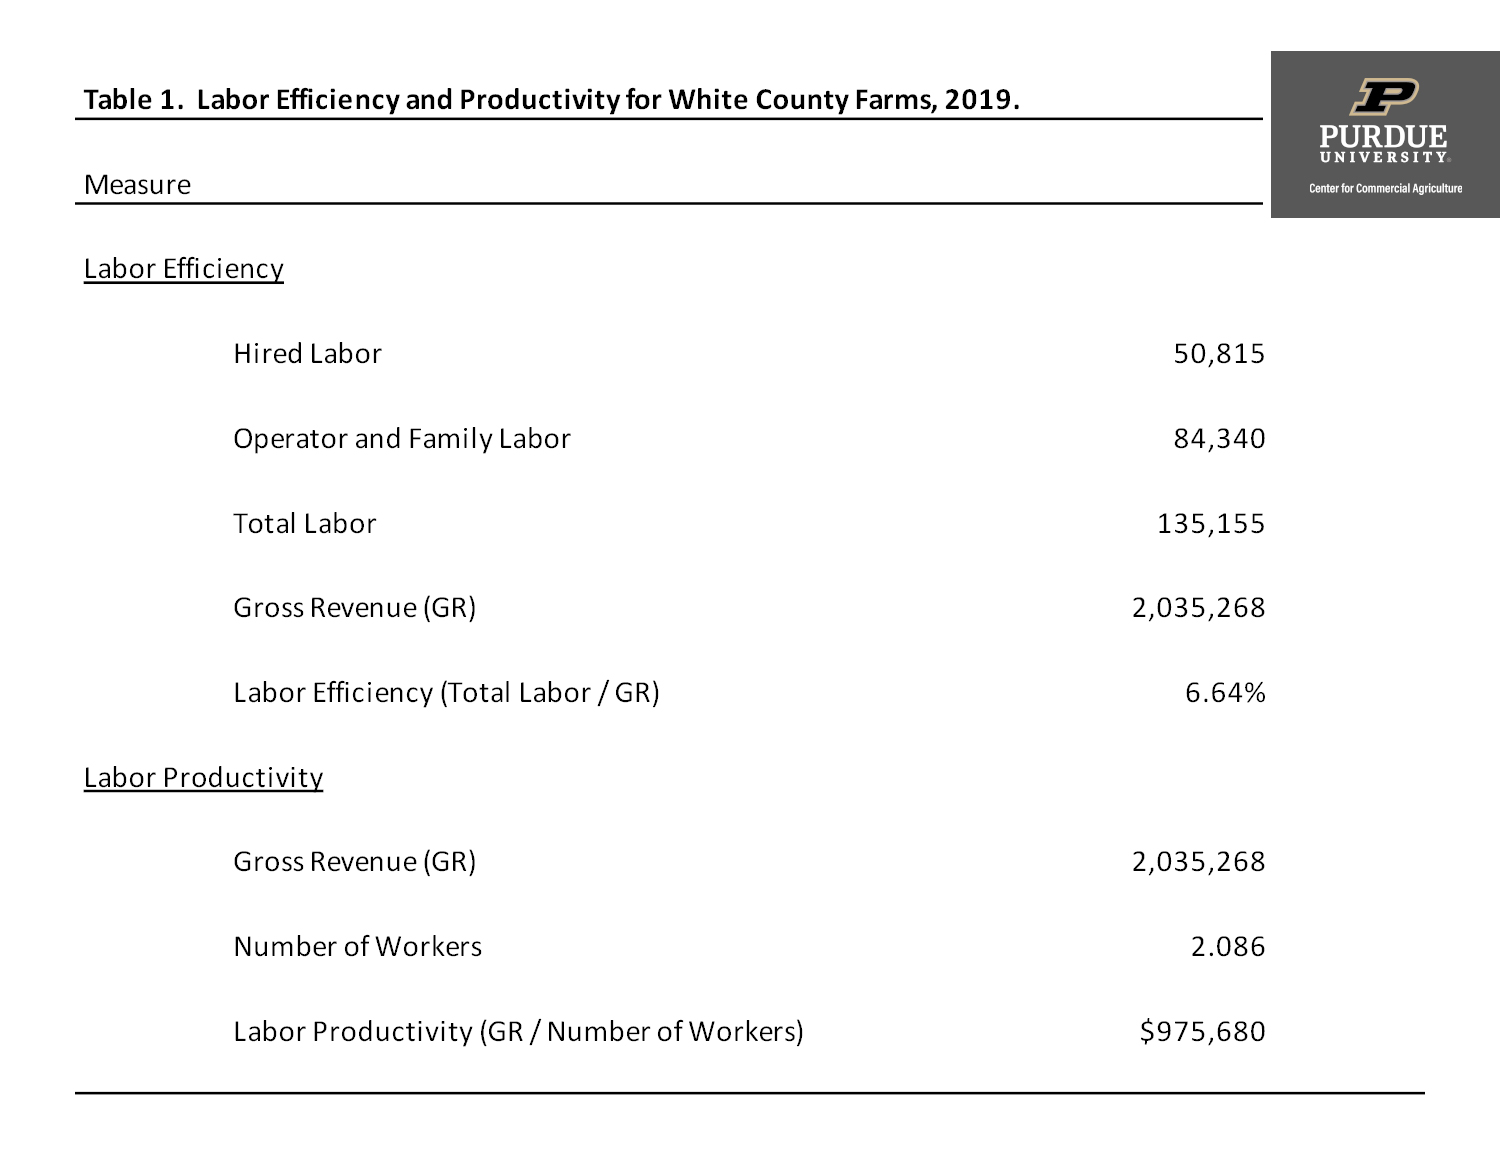
Table 1. Labor Efficiency and Productivity for White County Farms, 2019.
Labor efficiency and productivity for a case farm in west central Indiana is presented in table 1. This case farm has 1500 acres of corn and 1500 acres of soybeans. The number of workers represents the operator, one full-time hired employee, and several part-time employees. Labor efficiency for this farm is approximately 6.6 percent. Gross revenue per worker is approximately $976,000 for the case farm. Information available from farm management association programs in Illinois, Kansas, and Minnesota suggest that for this size and type of farm, labor efficiency should be below 10 percent and labor productivity should be above $500,000 per worker. The benchmark values for the case farm achieved these targets. As noted above, this farm should also check its machinery benchmarks to determine whether it is doing a good job of controlling both machinery and labor costs.
This article defined, described, and illustrated labor efficiency and productivity measures for a case farm. The case farm had labor benchmarks that met the specified targets. Other articles in the financial management series discuss profitability and financial efficiency benchmarks, repayment capacity benchmarks, and machinery investment and cost benchmarks.
![]()
![]()
![]()
![]()
![]()
TEAM LINKS:

PART OF A SERIES:

RELATED RESOURCES
UPCOMING EVENTS
We are taking a short break, but please plan to join us at one of our future programs that is a little farther in the future.