September 2, 2020
Computation of Deferred Tax Liabilities
by Michael Langemeier
![]()
![]()
![]()
![]()
![]()
This article is one of a series of financial management articles that examine financial statements and financial analysis. Income tax liabilities arise from differences between balance sheet values of certain assets and liabilities, and the tax basis of those same assets and liabilities. Deferred taxes reconcile the tax basis of balance sheet assets and liabilities with the basis currently being used to value assets and liabilities on a balance sheet, which is usually market value. The question to be answered is as follows: if all assets could be liquidated for exactly the amount shown on the balance sheet, what would be the resulting taxable income and tax liability? To illustrate deferred tax liabilities, this article will use balance sheets for a cash crop farm in west central Indiana.
Tables 1 and 2 illustrate a market value balance sheet with and without deferred tax liabilities. Table 1 contains a beginning, an ending, and an average balance sheet without deferred tax liabilities. Table 2 is identical to Table 1 except for its inclusion of the current portion of deferred taxes and the noncurrent portion of deferred taxes. Tables 3 and 4 present the computations of deferred tax liabilities. A 30 percent tax rate is used to compute deferred tax liabilities.
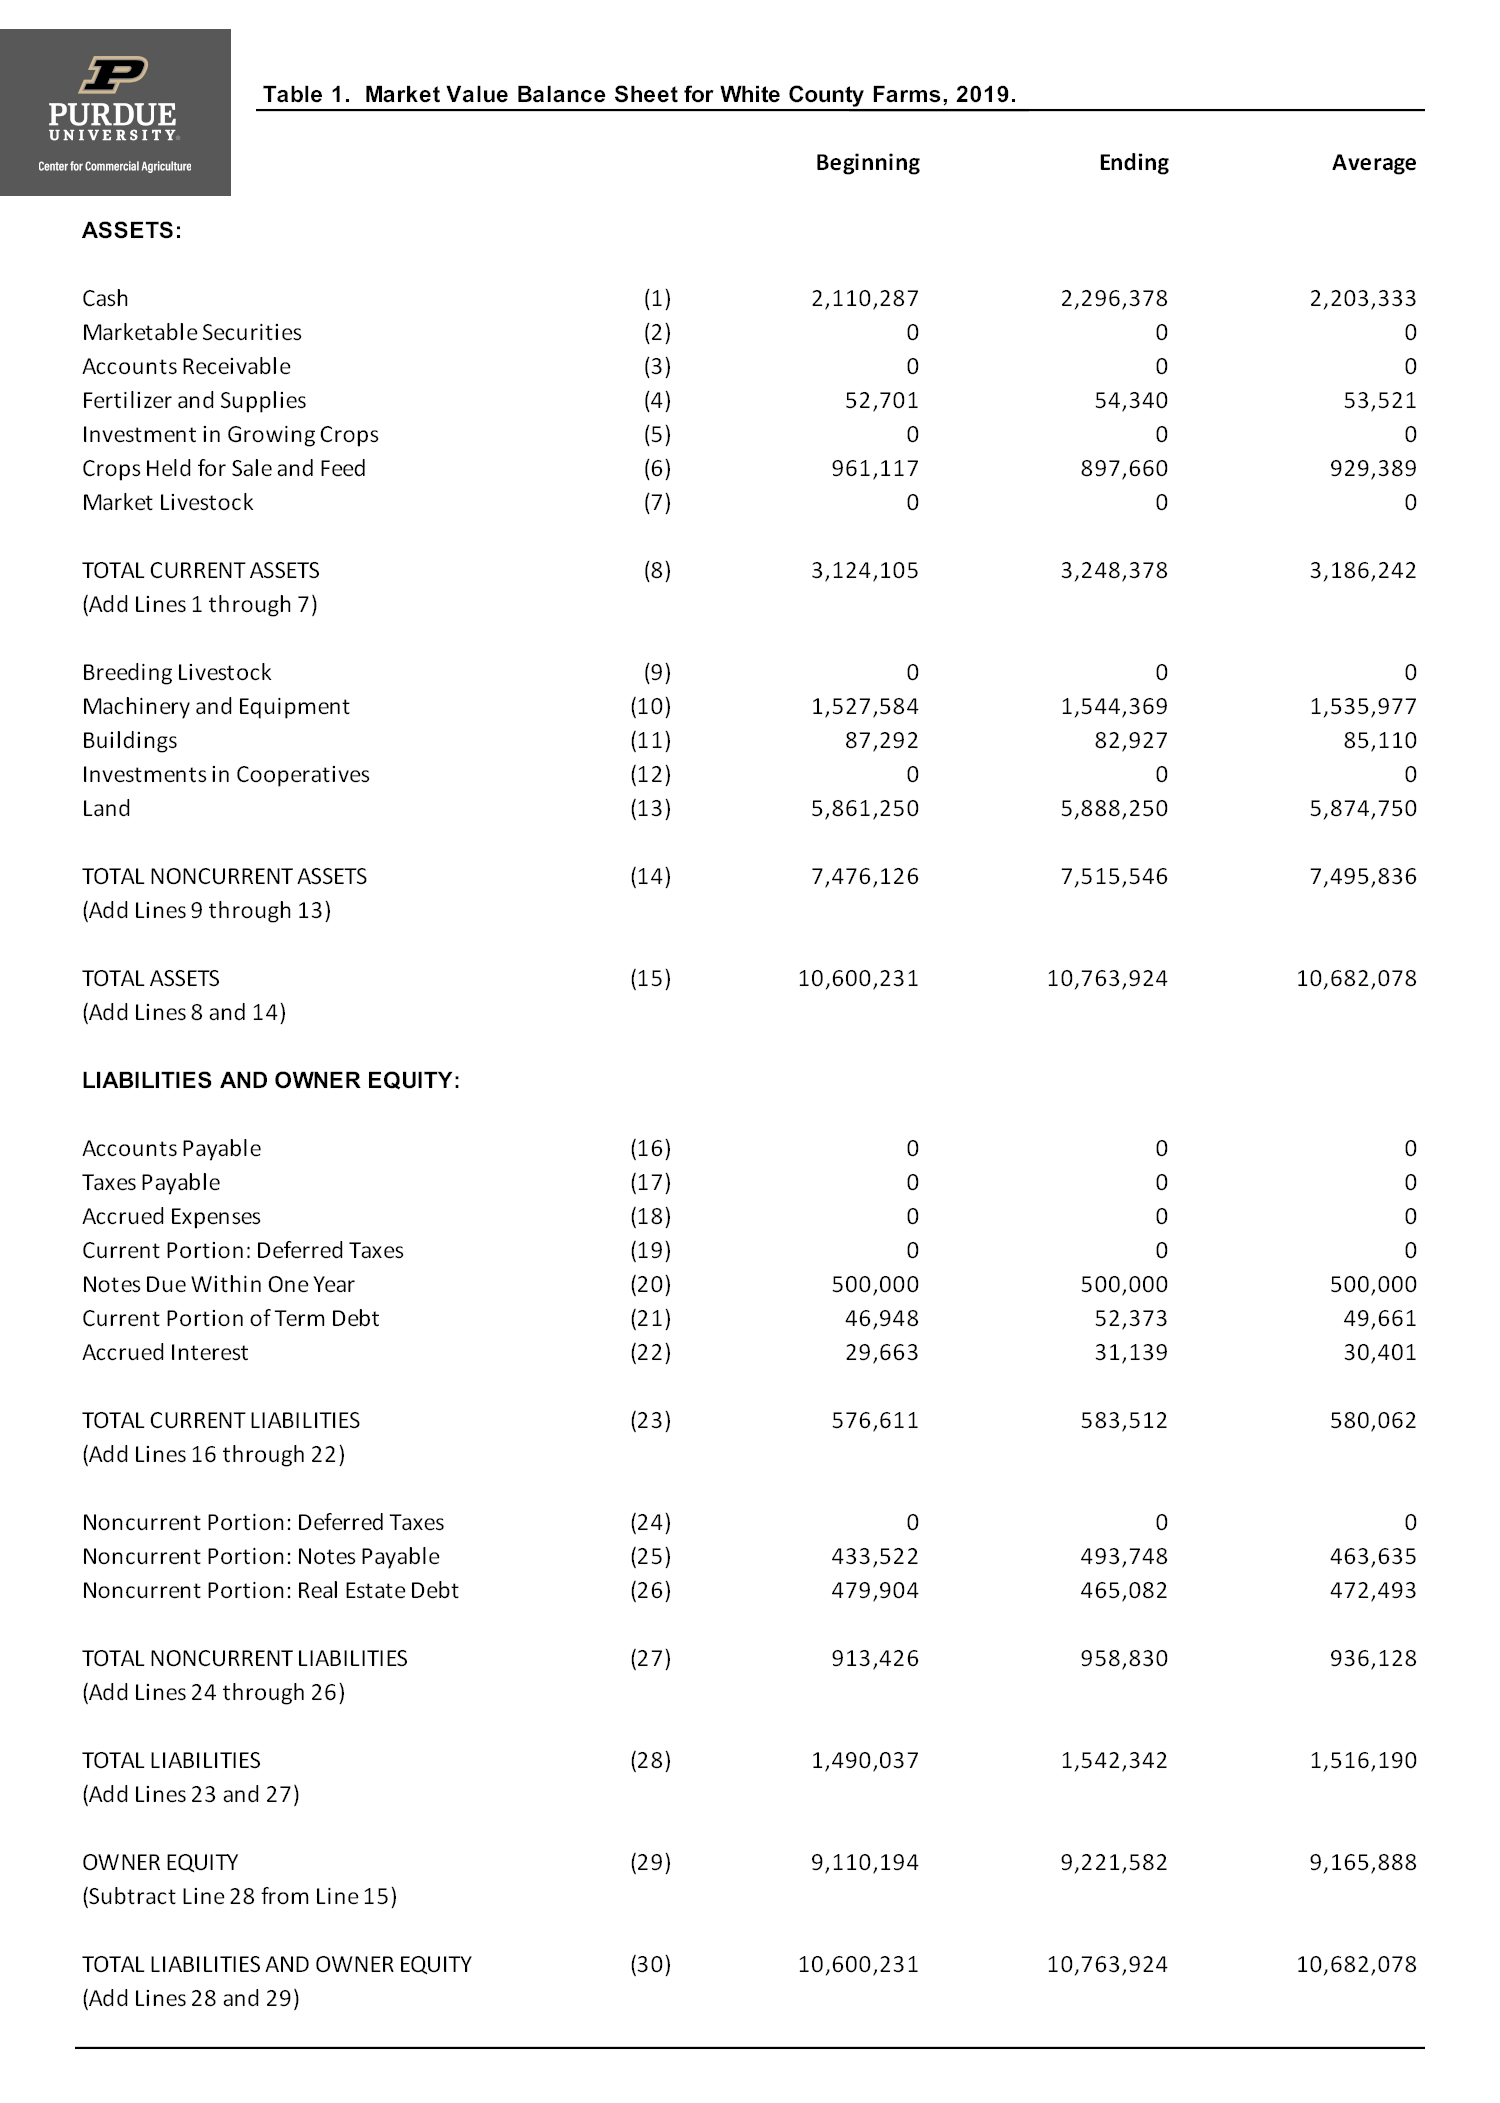
Table 1. Market Value Balance Sheet for White County Farms, 2019.
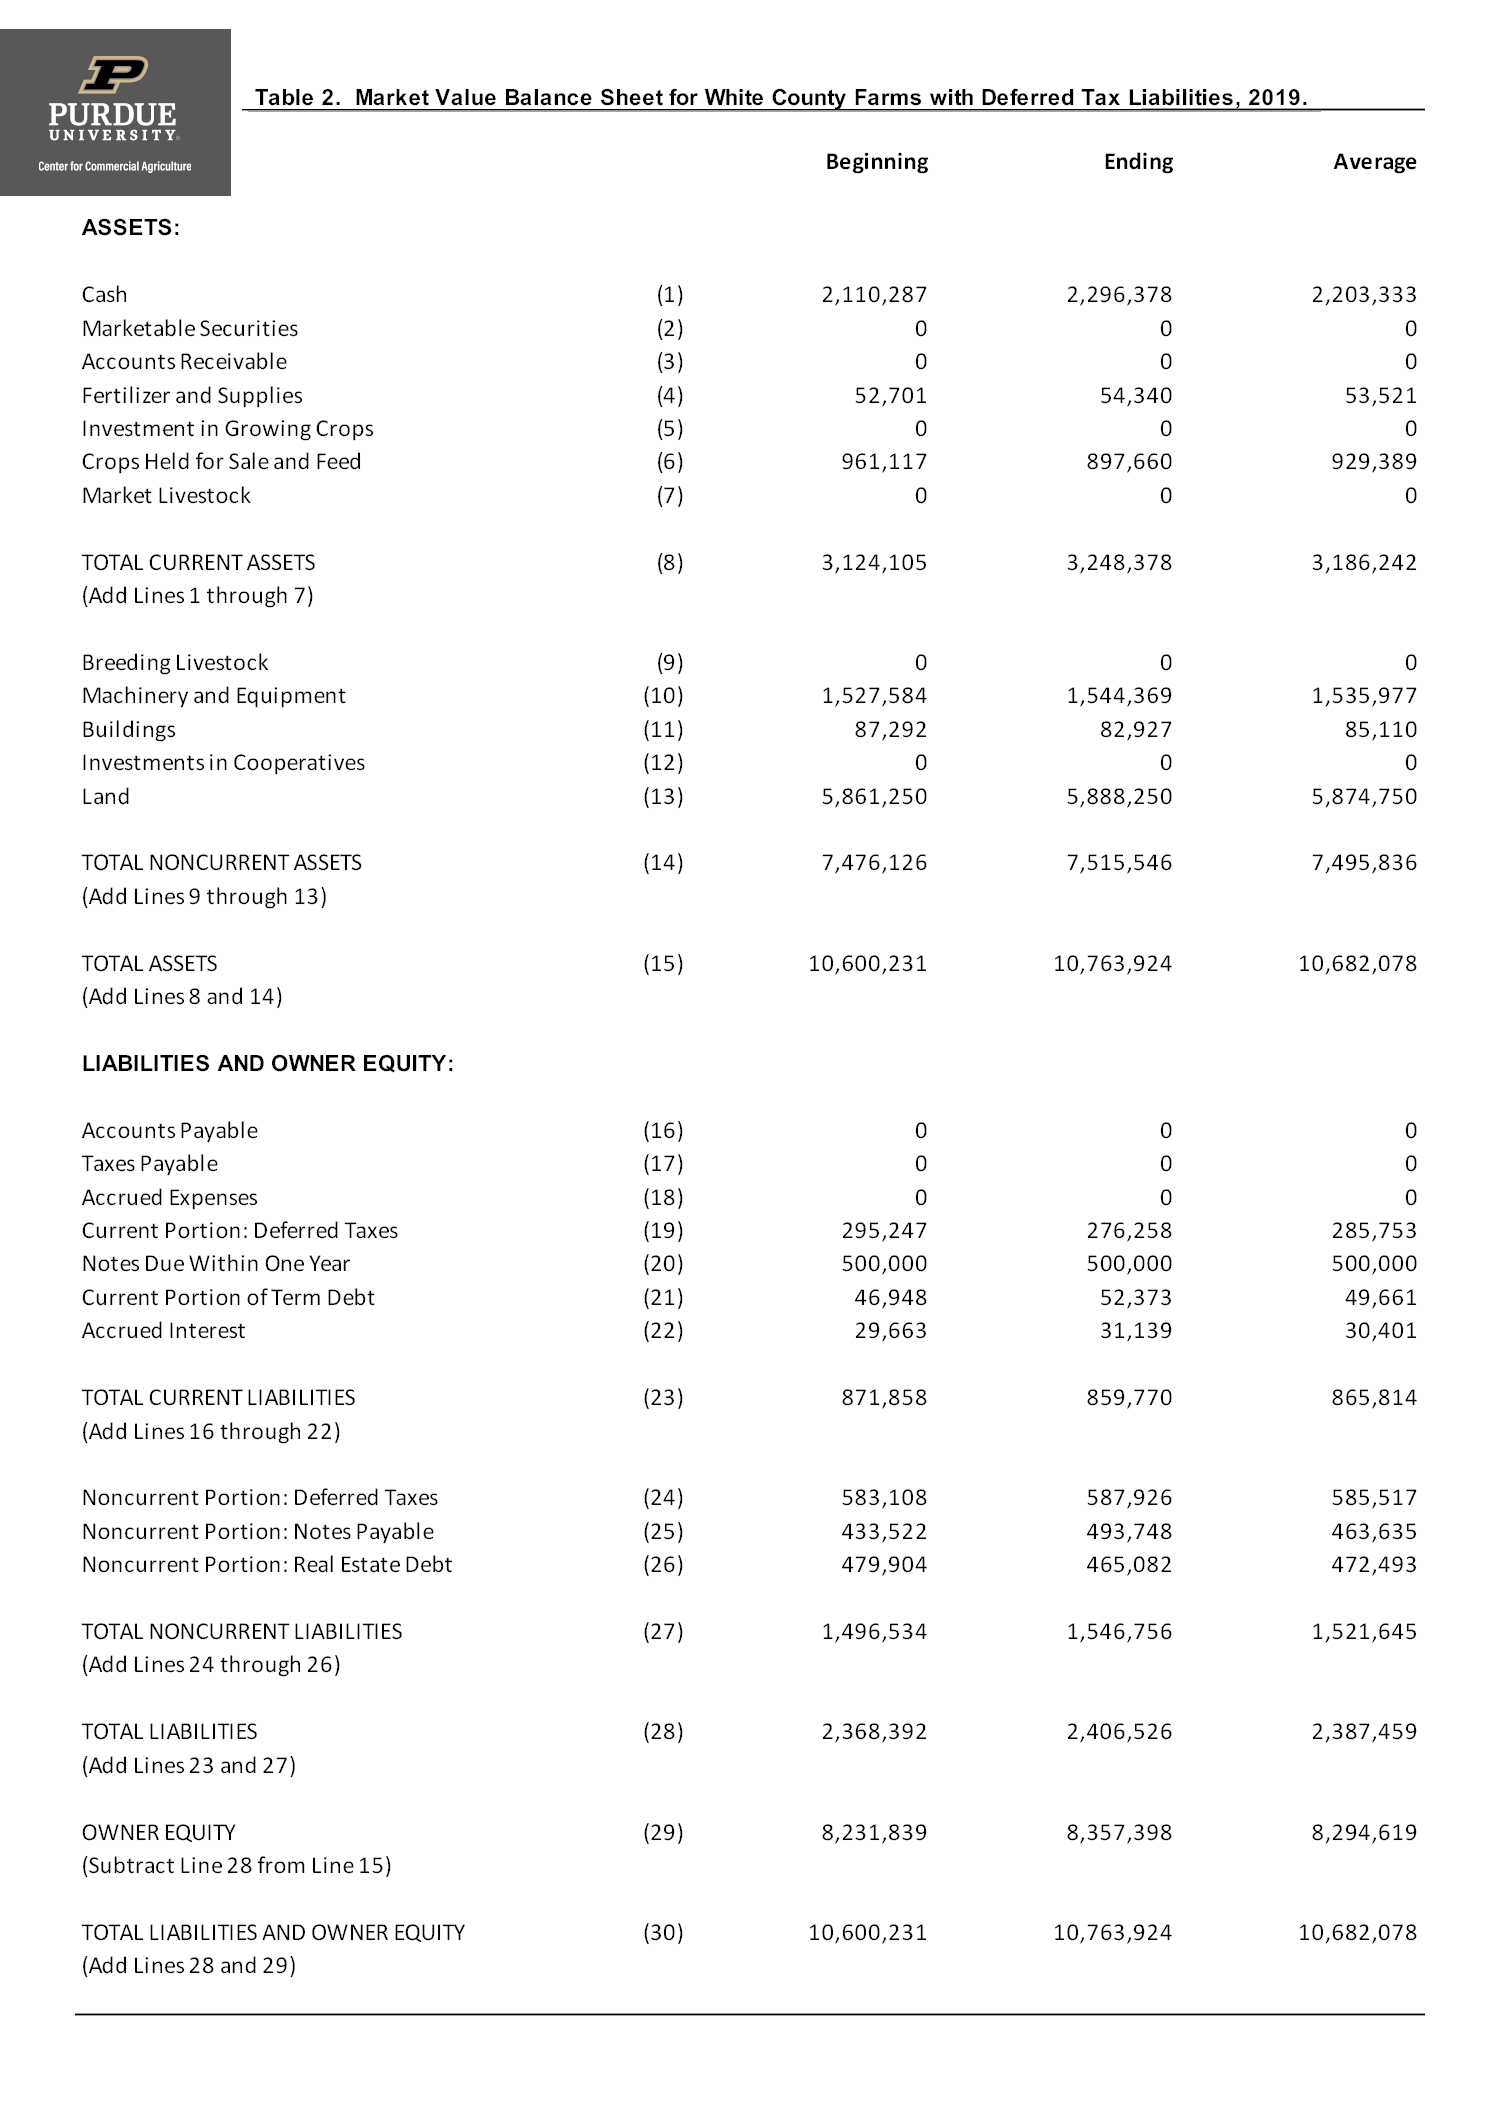
Table 2. Market Value Balance Sheet for White County Farms with Deferred Tax Liabilities, 2019.
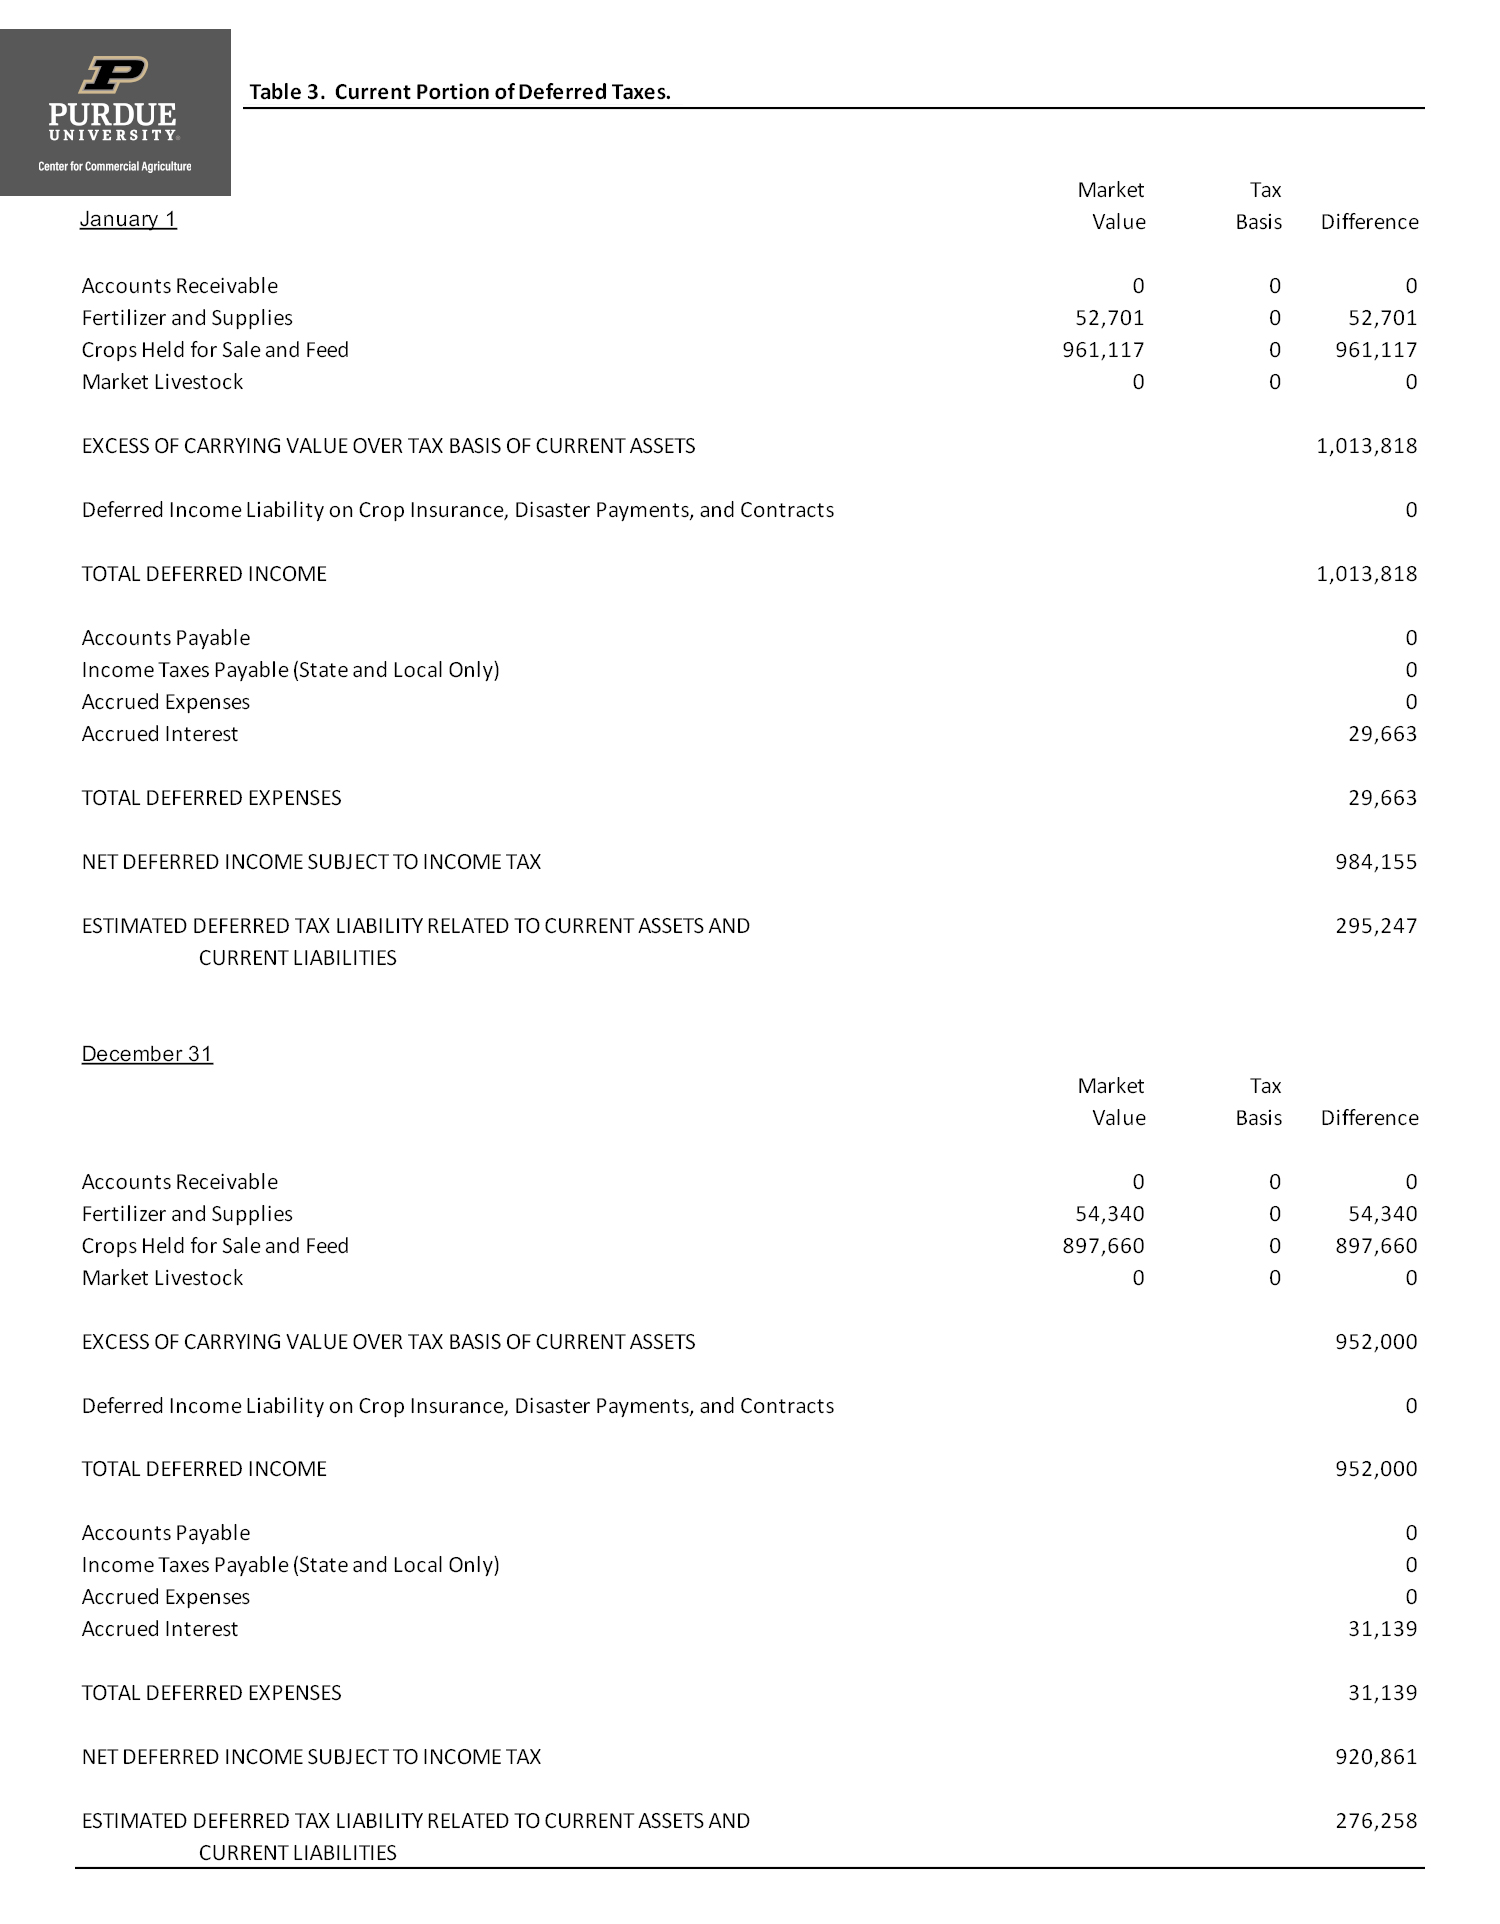
Table 3. Current Portion of Deferred Taxes.
As illustrated in Table 3, the current portion of deferred taxes largely arises from crop inventories. These inventories have a basis of zero because the expenses related to producing these crops have been deducted in the previous year. Inclusion of the current portion of deferred taxes reduces average working capital from $2,664,866 to $2,388,608 or approximately 10.4 percent. This farm still has substantial liquidity after accounting for the current portion of deferred taxes. However, it is important to note that the average tax liability is not small ($285,753) and this money could have certainly been used to cushion losses or to assist with asset purchases.
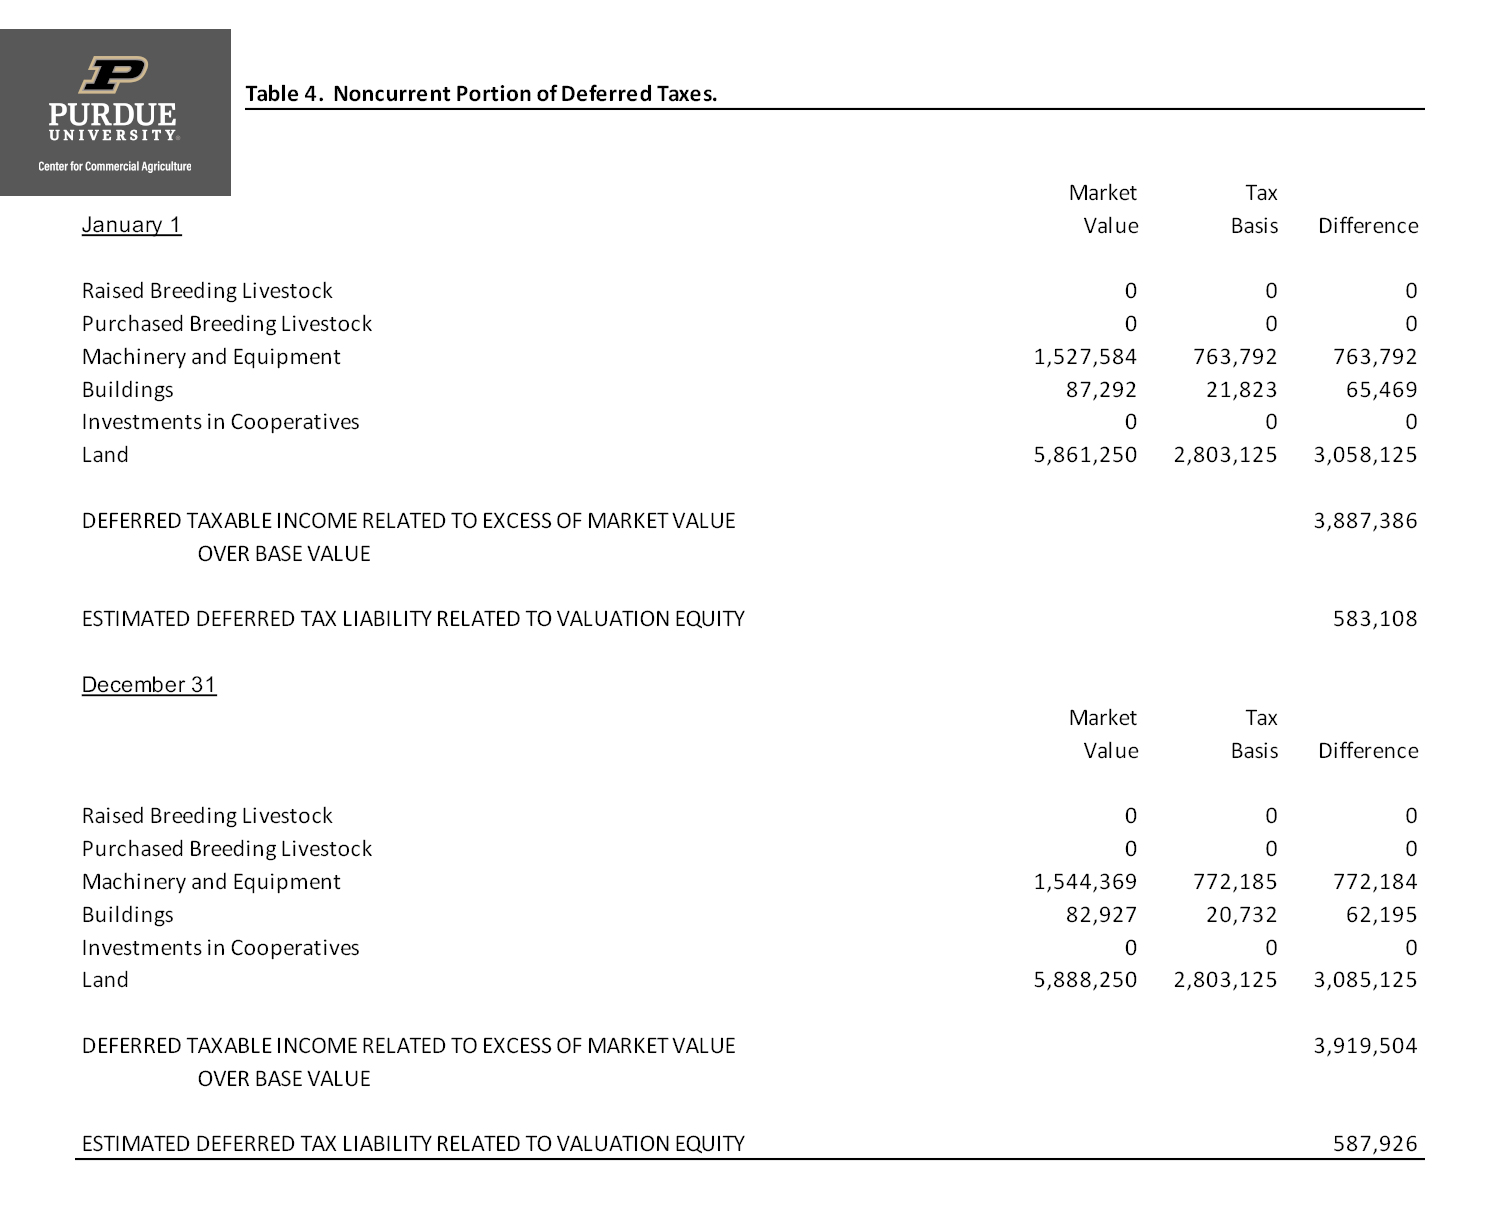
Table 4. Noncurrent Portion of Deferred Taxes.
The noncurrent portion of deferred taxes is estimated in Table 4. Looking at Table 2, which contains the numbers illustrated in Table 4, average deferred taxes on noncurrent assets is $585,517. A sizable portion of these taxes arises from the potential sale of land, which for this farm was primarily purchased more than 10 years ago. However, the deferred taxes for machinery and equipment are also quite large. Deferred taxes for machinery and equipment are due to the fact that tax depreciation is typically quite large compared to the actual decline in machinery and equipment value (i.e., economic depreciation). In recent years, tax depreciation has been relatively high due to accelerated depreciation rules and large section 179 expense deductions. The section 179 expense deduction allowed qualifying farmers to recover all or part of the cost of machinery and equipment in the year it was purchased on their tax forms. If used, this deduction created a large reduction of the tax basis of machinery and equipment in the first year of ownership, and subsequently could result in large tax obligations if the machinery and equipment have to be sold.
This article illustrated deferred tax liabilities for a cash crop farm in west central Indiana. The recent low crop prices could make deferred taxes an important issue for farms with limited liquidity levels. If crop inventories from previous years need to be liquidated to meet cash flow requirements, taxes will have to be paid on the income from these sales. Taxes are also likely to be incurred if a farm is forced to sell assets that were purchased in recent years.
![]()
![]()
![]()
![]()
![]()
TEAM LINKS:

PART OF A SERIES:

RELATED RESOURCES
UPCOMING EVENTS
We are taking a short break, but please plan to join us at one of our future programs that is a little farther in the future.