October 13, 2020
U.S. Farm Sector Capital Expenditures
by Michael Langemeier
![]()
![]()
![]()
![]()
![]()
Real U.S. net farm income is forecasted to be approximately $102.0 billion in 2020, which if realized would represent the largest net farm income since 2013. Real U.S. capital expenditures on machinery, buildings, and land improvements peaked in 2014 at $47.9 billion, but are forecasted to only be $29.9 billion in 2020. It will be interesting to see if capital expenditures increase in response to potentially higher net farm income in the next couple of years. This article examines trends in capital expenditures and compares capital expenditures to capital consumption (i.e., economic depreciation).
Trends in Real Capital Expenditures
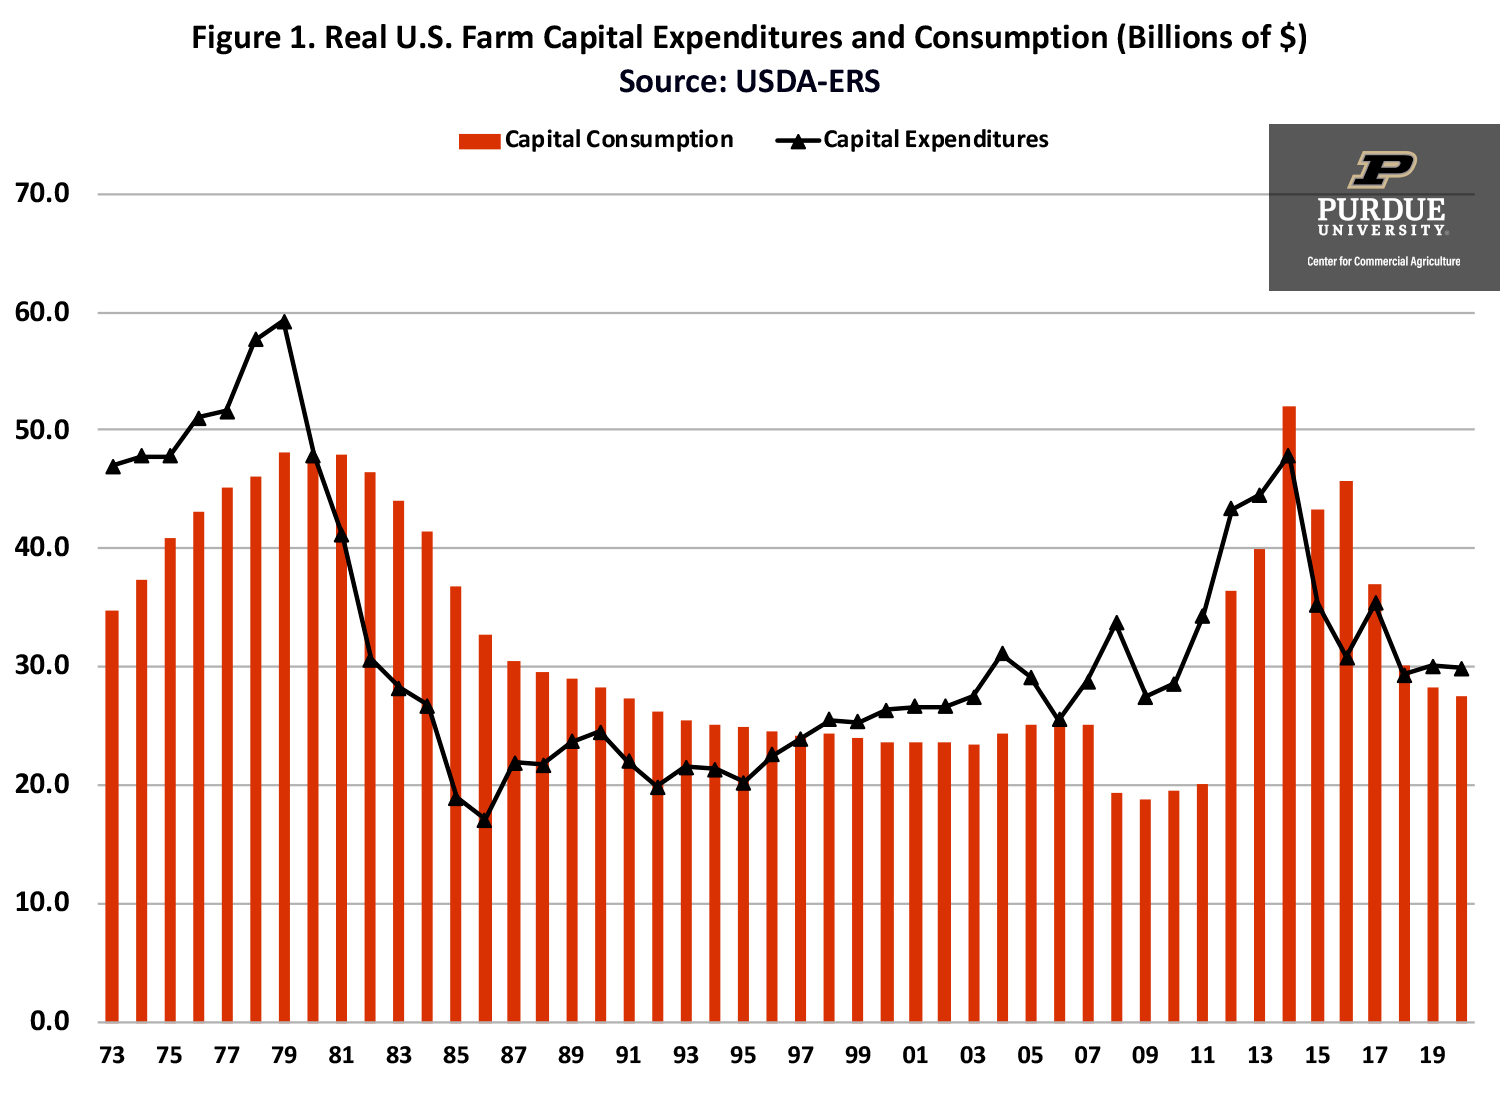
Figure 1. Real U.S. Farm Capital Expenditures and Consumption (Billions of $)
Source: USDA-ERS
Figure 1 illustrates real U.S. farm capital expenditures and consumption from 1973 to 2020. The 2020 value represents a forecast. Capital expenditures and consumption are expressed in 2019 dollars in figure 1. Capital expenditures include tractors, trucks, autos, machinery, buildings, land improvements, and miscellaneous capital expenditures. Capital consumption represents the declining balance of capital stock or economic depreciation. Using figure 1, two large increases in capital expenditures and two large decreases in capital expenditures have occurred since 1973. The first increase occurred during the 1973 to 1979 period. During this period, real capital expenditures increased from $46.9 billion in 1973 to $59.2 billion in 1979. The 1979 peak represents the highest annual capital expenditures level since 1973. The second increase occurred during the 2009 to 2014 period. During this period, real capital expenditures increased from $27.5 billion to $47.9 billion. The first large decrease in real capital expenditures occurred from 1979 to 1986. Real capital expenditures declined approximately 71 percent from the 1979 peak to the 1986 trough. The second large decrease is currently playing out. Since the 2014 peak, real capital expenditures have declined approximately 37 percent.
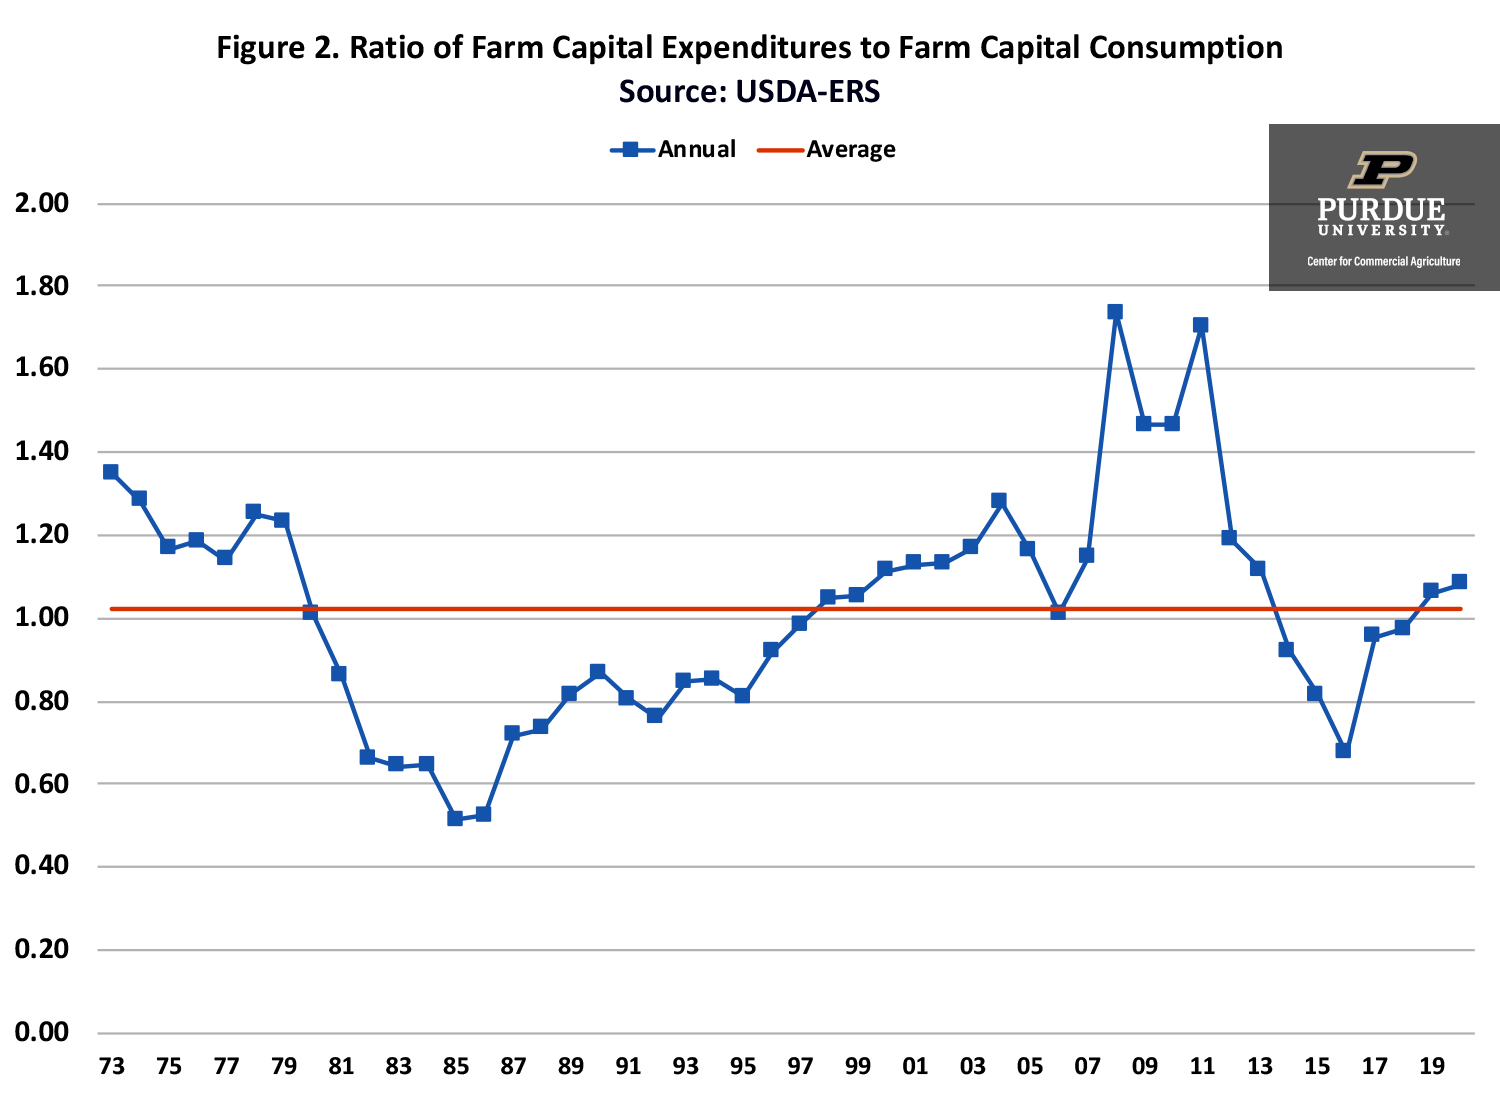
Figure 2. Ratio of Farm Capital Expenditures to Farm Capital Consumption
Source: USDA-ERS
An alternative way to examine trends in capital expenditures and consumption is to compute the ratio of capital expenditures to capital consumption. This ratio is depicted in figure 2. A ratio above 1 indicates that capital is being replaced at a rate higher than economic depreciation. Conversely, a ratio below 1 indicates that economic depreciation is larger than capital replacement. The average ratio over the 1973 to 2020 period was 1.020, which indicates that on average capital replacement exceeded capital consumption. The annual ratio appears to be quite cyclical. The ratio of capital expenditures to capital consumption was above 1 from 1973 to 1980, below 1 from 1981 to 1997, above 1 from 1998 to 2013, below 1 from 2014 to 2018, and above 1 in 2019 and 2020. The lowest annual ratios occurred during the 1980s farm financial crisis. As noted above there was a substantial decrease in capital expenditures in the 1980s. At the trough (i.e., 1986), the capital expenditure to capital consumption ratio was only 0.52. The three highest ratios occurred in 2008 (1.73), 2010 (1.47), and 2011 (1.70). Obviously, U.S. farms replaced a substantial portion of their depreciable capital during the 2007 to 2013 period. The ratio dropped from 0.92 to 0.67 from 2014 to 2016, and then increased to 1.08 in 2020. The fact that the ratio has been above 1 the last couple of years indicates that U.S. farms have been able to fully compensate for the decline in machinery value associated with economic depreciation through machinery purchases the last couple of years.
The discussion above applies to total capital expenditures. The changes in expenditures since the most recent peak in 2014 differs among expenditure categories. Data by expenditure category is not available for 2020, so percentage decreases were computed using 2014 and 2019 data. The decline in total capital expenditures from 2014 to 2019 was 32.9 percent. The decline in expenditures for tractors (25.3 percent), autos (32.4 percent), and buildings (20.8 percent) were lower than the drop in total capital expenditures. In contrast, expenditures for trucks (38.9 percent), machinery (41.0 percent), and land improvements (35.5 percent) were relatively higher than the decline in total capital expenditures.
Capital Spending Diffusion Index
The Federal Reserve Bank of Kansas City (here) has reported a capital diffusion index on a quarterly basis since the second quarter of 2002. This diffusion index is computed by asking bankers whether capital spending during a quarter was higher than, lower than, or the same as in the year-earlier period. The index is then computed by subtracting the percentage of bankers who responded “lower” from the percentage who responded “higher” and adding 100. An index below 100 indicates that capital spending is relatively lower than the year-earlier period. Conversely, an index above 100 indicates that capital spending is relatively higher than the year-earlier period.
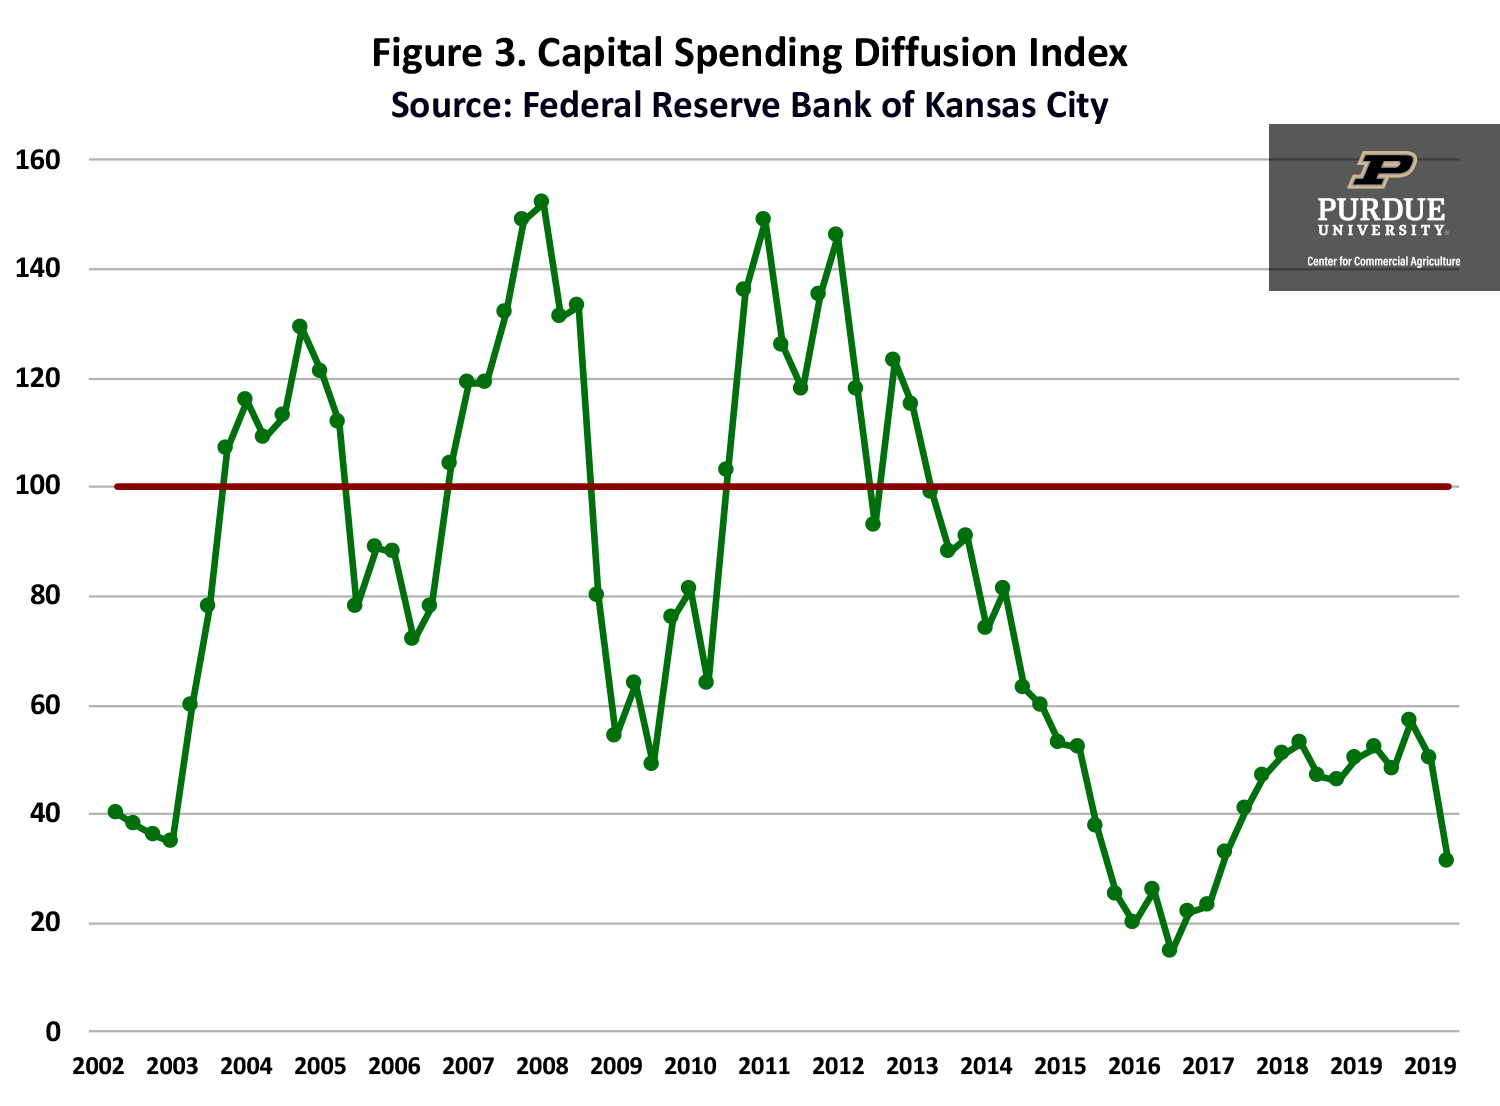
Figure 3. Capital Spending Diffusion Index
Source: Federal Reserve Bank of Kansas City
Figure 3 reports the capital spending diffusion index from the second quarter of 2002 to the second quarter of 2020. An index below 100 means that a higher percentage of agricultural bankers thought capital spending was lower than the percentage of agricultural bankers of agricultural bankers that thought capital spending was higher. The index has been below 100 since the second quarter of 2013. The lowest index since then occurred in the third quarter of 2016 (diffusion index value of 15). The index value was 50 in the first quarter of 2020 and 31 in the second quarter of 2020.
Conclusions
Real capital expenditures on U.S. farms have dropped significantly since 2014. In addition, the capital spending diffusion index reported by the Federal Reserve Bank of Kansas City has been below 100 since the second quarter of 2013. Real net farm income in 2020 is projected to be above the long-run average since 1973. If net farm income remains relatively high the next couple of years, we will probably see an increase in capital expenditures for machinery, buildings, and land improvements.
References
Federal Reserve Bank of Kansas City. “Agriculture and the Economy.” www.kansascityfed.org/research/agriculture, accessed October 8, 2020.
USDA-ERS. “Farm Income and Wealth Statistics.” www.ers.usda.gov/data-products/farm-income-and-wealth-statistics/, accessed October 8, 2020.
![]()
![]()
![]()
![]()
![]()
TEAM LINKS:

PART OF A SERIES:

RELATED RESOURCES
UPCOMING EVENTS
We are taking a short break, but please plan to join us at one of our future programs that is a little farther in the future.