Farmer sentiment drifts lower, rising interest rates contribute to uneasiness
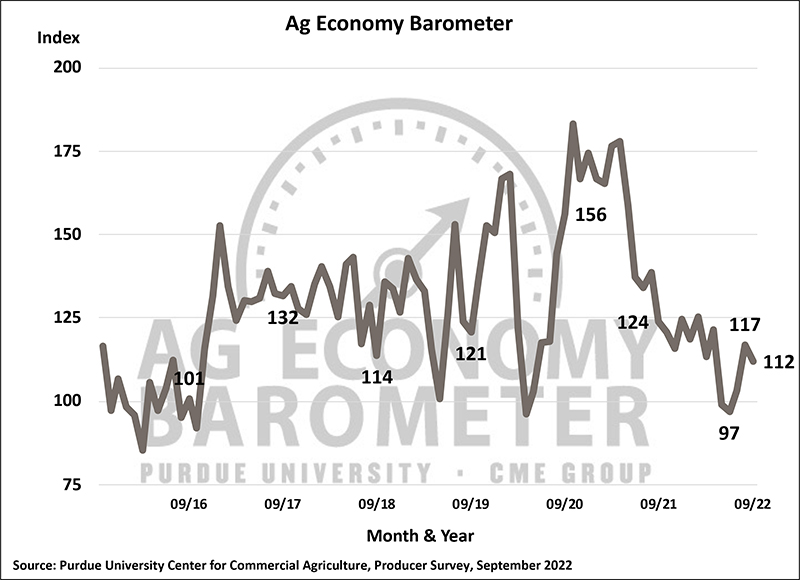
The Purdue University/CME Group Ag Economy Barometer farmer sentiment index declined 5 points to a reading of 112 in September. The decline in farmer sentiment was primarily the result of producers’ weakened perception of current conditions, as the Current Conditions Index declined 9 points to 109. The Index of Future Expectations also weakened slightly, declining 3 points from a month earlier to a reading of 113. The Ag Economy Barometer is calculated each month from 400 U.S. agricultural producers’ responses to a telephone survey. This month’s survey was conducted Sept. 19-23.
“Concerns about input costs and, in some cases, availability are key factors behind the relative weakness in this month’s farmer sentiment,” said James Mintert, the barometer’s principal investigator and director of Purdue University’s Center for Commercial Agriculture. “However, a growing number of producers are also concerned about the impact of rising interest rates on their farm operations.”
Higher input costs remain the number one concern among survey respondents. In September, 44% of respondents chose “higher input costs” as their number one concern, while 23% chose “rising interest rates,” and 14% chose “availability of inputs.” When asked to look ahead to 2023, the largest share (38%) of producers expect input prices to rise from 1% to 9% compared to 2022 prices. Meanwhile, nearly a fourth (24%) of producers expect input prices to rise from 10% to 19%, and 9% of survey respondents said they expect an input price rise of 20% or more.
The Farm Capital Investment Index declined to a record low of 31 in September, as producers continue to indicate now is not a “good time” to make large investments in their farming operations. To understand why they felt that way, a follow-up question was posed to farmers who reported now being a “bad time” to make large investments. For the third month in a row, producers overwhelmingly (46%) said it was due to increasing prices for farm machinery and new construction; however, 21% indicated that “rising interest rates” were a primary reason, up from 14% who cited interest rates in August.
Despite that negative perspective, fewer producers plan to reduce their farm machinery purchases. Since peaking in March 2022 at 62%, the share of producers who plan to reduce their machinery purchases compared to a year earlier has been declining, dipping to 47% in September. Their plans for farm building purchases tell a similar story. Since the March 2022 high of 68%, producers who planned to reduce their building and grain bin purchases has fallen to 56% in September.
Producers’ perspective on farmland values continues to soften. This month, the Short-Term Farmland Value Expectations Index fell 5 points to 123, and the Long-Term Farmland Value Expectations Index fell 7 points to 139. Compared to a year ago, the short-term index is down 21%, while the long-term index has fallen 12% over the same time frame. In a follow-up question posed to respondents who expect farmland values to rise over the next 5 years, nonfarm investor demand (60%) remains their primary reason for the rise.
This month’s survey included a series of questions to understand producers’ cover crop usage. Nearly six out of 10 (57%) respondents said they currently plant cover crops on a portion of their farmland, while approximately one in four producers said they have never planted a cover crop. Most producers who report planting cover crops say they only plant them on a portion of their farmland, with half indicating they plant on 25% or less of their acreage. However, some farms report more intensive use of cover crops as nearly a fourth of respondents said they plant cover crops on over 50% of their farms’ acreage. A large share (40%) of producers who reported planting cover crops this month said they have been planting cover crops for five years or less, while 28% of respondents said they have been planting cover crops for more than 10 years. The reasons for planting cover crops vary, with 37% citing “improve soil health” and 33% citing “improve erosion control” as the primary motivators. Just 5% of cover crop users indicated “carbon sequestration” as a motivation for planting cover crops.
Read the full Ag Economy Barometer report. The site also offers additional resources – such as past reports, charts and survey methodology – and a form to sign up for monthly barometer email updates and webinars.
Each month, the Purdue Center for Commercial Agriculture provides a short video analysis of the barometer results. For even more information, check out the Purdue Commercial AgCast podcast. It includes a detailed breakdown of each month’s barometer, in addition to a discussion of recent agricultural news that affects farmers.
The Ag Economy Barometer, Index of Current Conditions and Index of Future Expectations are available on the Bloomberg Terminal under the following ticker symbols: AGECBARO, AGECCURC and AGECFTEX.
About the Purdue University Center for Commercial Agriculture
The Center for Commercial Agriculture was founded in 2011 to provide professional development and educational programs for farmers. Housed within Purdue University’s Department of Agricultural Economics, the center’s faculty and staff develop and execute research and educational programs that address the different needs of managing in today’s business environment.
About CME Group
As the world’s leading and most diverse derivatives marketplace, CME Group (www.cmegroup.com) enables clients to trade futures, options, cash and OTC markets, optimize portfolios, and analyze data – empowering market participants worldwide to efficiently manage risk and capture opportunities. CME Group exchanges offer the widest range of global benchmark products across all major asset classes based on interest rates, equity indexes, foreign exchange, energy, agricultural products and metals. The company offers futures and options on futures trading through the CME Globex® platform, fixed income trading via BrokerTec and foreign exchange trading on the EBS platform. In addition, it operates one of the world’s leading central counterparty clearing providers, CME Clearing. With a range of pre- and post-trade products and services underpinning the entire lifecycle of a trade, CME Group also offers optimization and reconciliation services through TriOptima, and trade processing services through Traiana.
CME Group, the Globe logo, CME, Chicago Mercantile Exchange, Globex, and E-mini are trademarks of Chicago Mercantile Exchange Inc. CBOT and Chicago Board of Trade are trademarks of Board of Trade of the City of Chicago, Inc. NYMEX, New York Mercantile Exchange and ClearPort are trademarks of New York Mercantile Exchange, Inc. COMEX is a trademark of Commodity Exchange, Inc. BrokerTec, EBS, TriOptima, and Traiana are trademarks of BrokerTec Europe LTD, EBS Group LTD, TriOptima AB, and Traiana, Inc., respectively. Dow Jones, Dow Jones Industrial Average, S&P 500, and S&P are service and/or trademarks of Dow Jones Trademark Holdings LLC, Standard & Poor’s Financial Services LLC and S&P/Dow Jones Indices LLC, as the case may be, and have been licensed for use by Chicago Mercantile Exchange Inc. All other trademarks are the property of their respective owners.


