May 6, 2011
The Economics of Prevented Planting
by Brent Gloy, George Patrick, and Michael Boehlje
![]()
![]()
![]()
![]()
![]()
With corn planting in the Eastern Corn Belt significantly behind schedule, many farmers are beginning to consider the possibility that exercising the prevented planting provisions in some crop insurance products may become a realistic option. From an economic perspective there are several factors that influence the attractiveness of this option. This article describes some of the economic dimensions of this decision.
First and foremost, farmers need to understand the crop insurance coverage that they have purchased and its provisions. The best way to accomplish this is to consult your crop insurance agent. The prevented and delayed planting provisions of crop insurance are complex and one must be careful to make sure that you understand the specific provisions in the policy that was actually purchased. The discussion in this article will focus on one specific policy, the COMBO insurance product with revenue protection (RP). The examples used in this document are not meant to be mutually exhaustive of the options that farmers have, they simply illustrate some basic choices and an economic approach to evaluating these options.
Farmers who are facing a situation in which a corn crop has not been planted by the insurance planting deadline face a number of decisions. Our analysis will focus on three alternatives:
- Take the prevented planting payment and do not harvest a crop on those acres.
- Plant a corn crop after the planting deadline.
- Plant a soybean crop instead of corn
Analyzing the Options
From an economic perspective, the key to making this decision is to consider only the incremental costs that will be incurred and the revenues that will result from this point forward. In other words, you should only evaluate the incremental costs and returns. This means that for each scenario one must estimate incremental costs and revenues. Previously incurred and unrecoverable costs should not influence the current decision.
Our approach will be to construct a simple partial budget analysis for each alternative and compare the net incremental returns against the base scenario of accepting a prevented planting payment. Because each individual situation is different, it is critical that farmers conduct the analysis using the specific details of their own situation. It is impossible to generalize a “best” decision for all farms. The details of each situation will matter. Additionally, the estimated crop yields for each scenario will be a key variable in the decision. Crop yields are notoriously difficult to forecast accurately and this is probably even worse when considering late planted crops.
The basic assumptions of this analysis are provided in Table 1. Here, the APH yields, coverage levels, and guarantees are provided for both corn and soybeans. A spreadsheet has been developed that allows farmers to enter their own information and conduct the analysis for their particular situation.
The values provided in Table 1 and the following tables are for illustration purposes. Farmers should use their own estimates of these values to obtain a more accurate estimate of the value of the various alternatives. The purpose of this discussion is to illustrate the analysis that should be done, the data needed to complete that analysis, as well as how to use and interpret the results obtained from the spreadsheet.
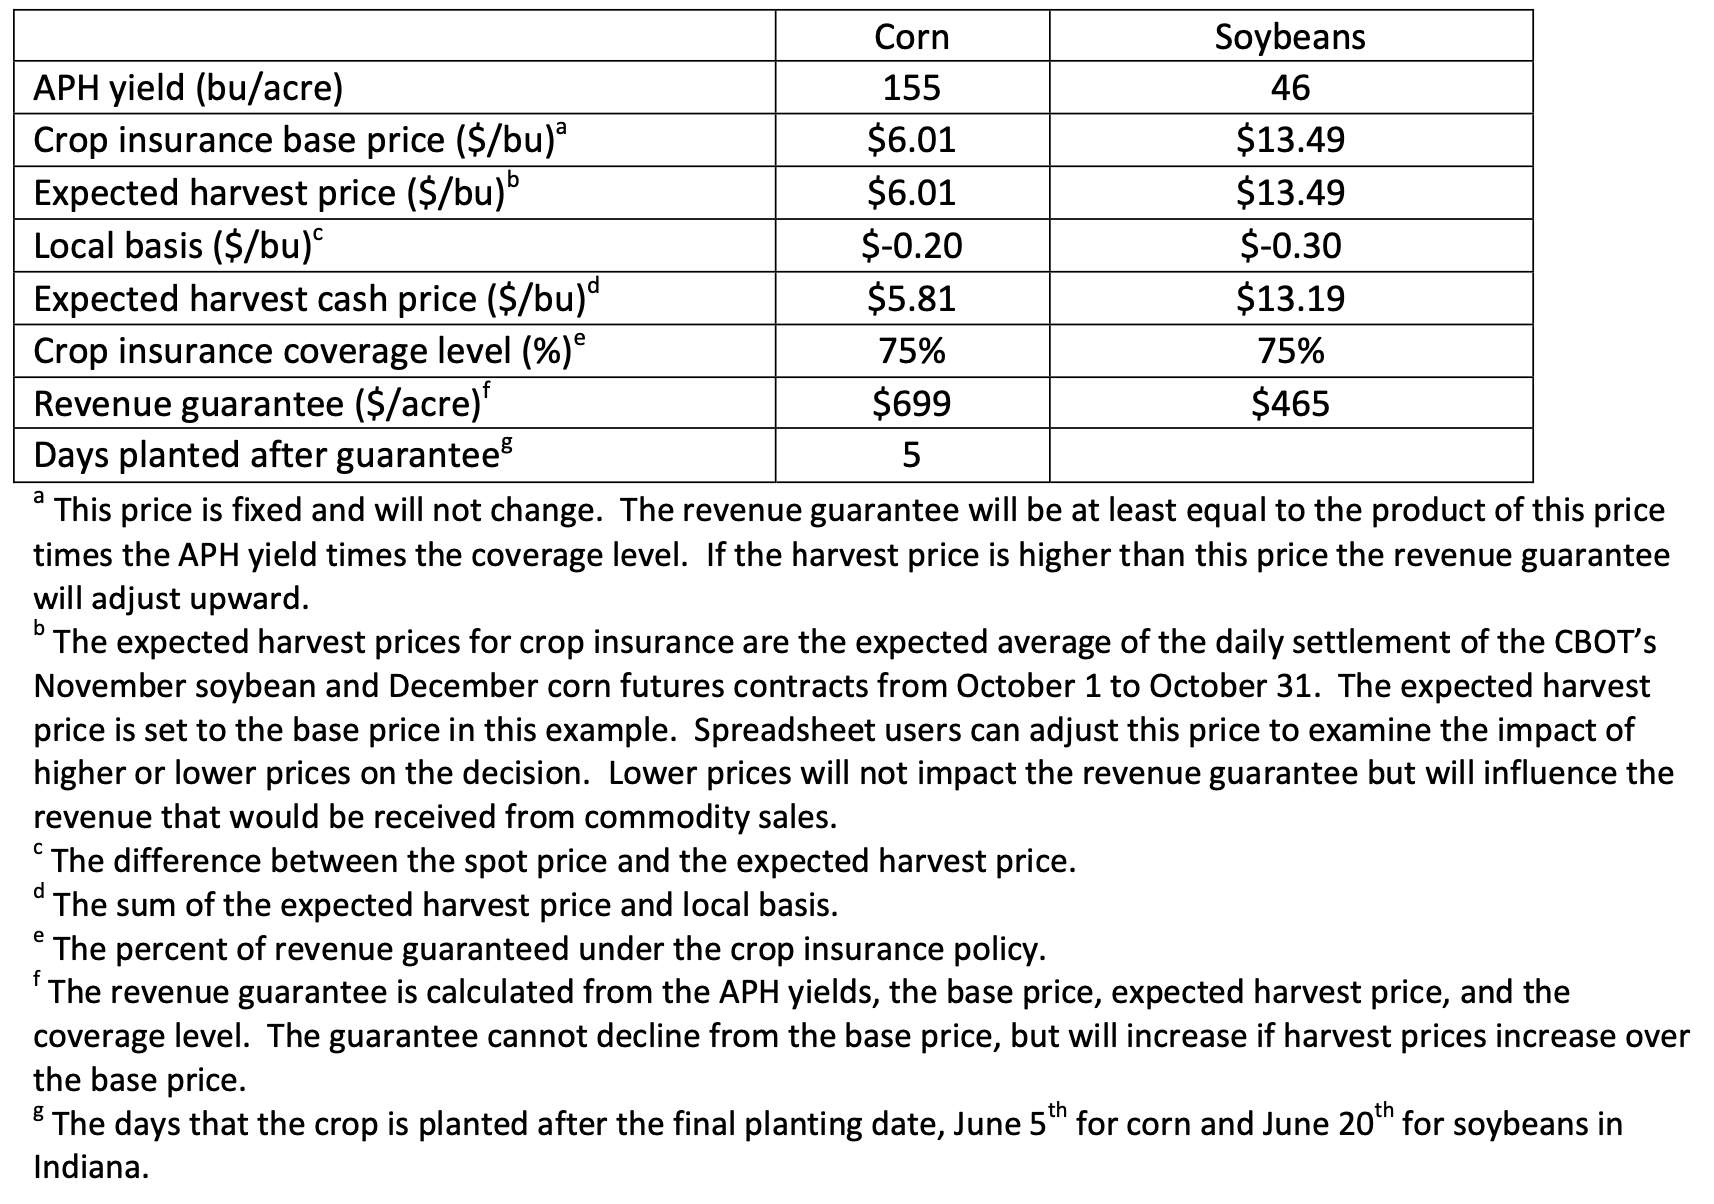
Table 1. Basic Assumptions for Prevented Planting Analysis Assuming Revenue Protection Crop Insurance.
The information in Table 1 provides some of the basic assumptions necessary to begin evaluating the decision. In this case the expected harvest price is set equal to the crop insurance base price. In situations where the expected harvest price rises, the crop insurance revenue guarantee will increase. This will influence the attractiveness of planting versus taking the prevented planting payment. Other things equal, increases in the expected harvest price will tend to make planting a crop more attractive. This is because the prevented planting payment does not increase if harvest prices rise whereas the revenue guarantee increases.
The calculation of the net incremental return from accepting the prevented planting payment is illustrated in Table 2. In order to properly evaluate this option, one must consider the potential revenue from accepting the payment as well as any costs associated with the decision. The revenues from the prevented planting include the payment and any credits for fertilizer that has been applied to support the prevented crop, but that will be stored in the ground until the next growing season.
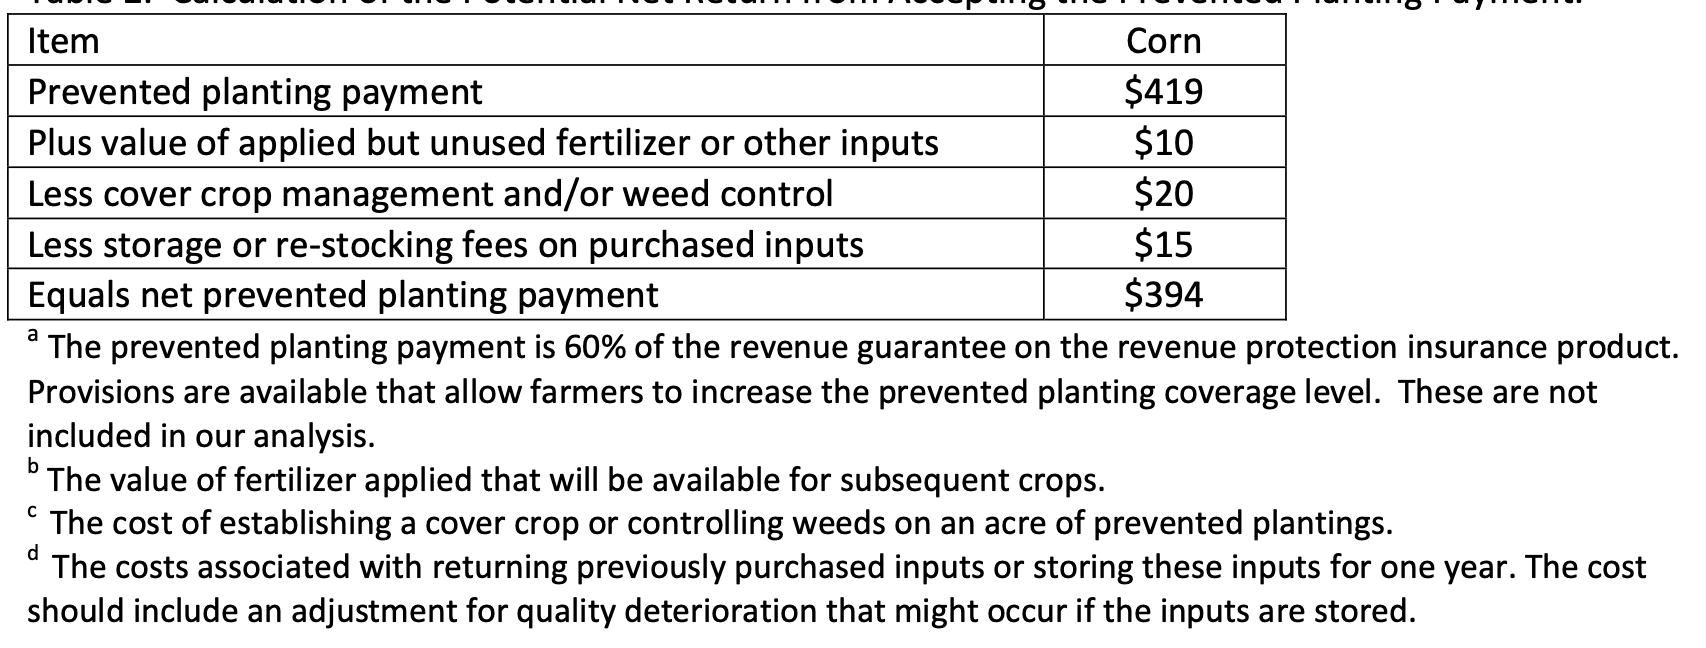
Table 2. Calculation of the Potential Net Return from Accepting the Prevented Planting Payment.
The prevented planting payment is calculated by multiplying the revenue guarantee by 60%. In this case the gross prevented planting payment is $419 ($699 revenue guarantee times 60%). In order to calculate the attractiveness of the prevented planting payment one must calculate the net return from accepting the payment. The acceptance of the payment requires that farmers cannot produce a cash crop on the acres for which the payment is accepted.
Farmers accepting this payment will face some costs associated with accepting the payment. For example, they will incur costs to plant a cover crop or control weeds on the field. In cases where fertilizer has already been applied to the acreage it may be possible to carryover some of this fertilizer. The net carryover value of this fertilizer should be included as a source of income for accepting the payment. One should be careful in assigning values to this item. The ability to carry this fertilizer over from year‐to‐year is difficult to estimate, and if the farm is cash rented, the farmer may not be able to rent it next year. In that situation, the value of fertilizer carryover is likely zero.
Farmers should also consider the implications of the decision to accept the prevented planting payment on any outstanding forward sale grain contracts. Finally, one must also consider any expenses associated with storing or returning unused inputs that were already purchased for the growing crops. Any restocking fees that would be incurred for returning chemical or seed inputs should be viewed as a cost of accepting the preventing planting payment.
Alternative Scenarios
The scenario considered in Table 2 is meant to reflect the situation where a farmer has already applied a significant amount of fertilizer. In addition, the re‐stocking costs indicate that the farmer will incur charges to return previously purchased inputs such as seed and chemicals. The magnitude of these values will vary substantially from situation to situation. Under these assumptions, by accepting the prevented planting payment for corn production the farmer would receive a net benefit of $394 per acre.
Next, this value will be compared to the alternatives of planting the corn crop late or switching the corn crop to soybeans and planting before the soybean late planting date of June 20. In order to evaluate these alternatives it is necessary to forecast the expected yield for the two crops. The expected yields are important because they will determine revenue that would be generated by crop sales and would also influence the amount of crop insurance payments that would be received.
The two scenarios considered here are planting corn 5 days after the prevented planting deadline or planting soybeans before Indiana’s June 20 soybean planting deadline. Yield forecasts for delayed planting were set to 120 bushels per acre for corn and 40 bushels per acre for soybeans. These values are simply for illustration purposes and are not meant to imply that these are the yields estimates that should be used on any individual farm. As noted earlier, predicting these yields is difficult. Farmers should evaluate a range of yields and determine how these yields impact the projected net returns for each planting alternative.
Again, one must evaluate the incremental costs associated with planting either corn or soybeans. Table 3 shows some of the potential incremental costs that will be considered in the analysis. This analysis focuses on incremental costs – those costs that must be incurred to produce the crop from this point forward.
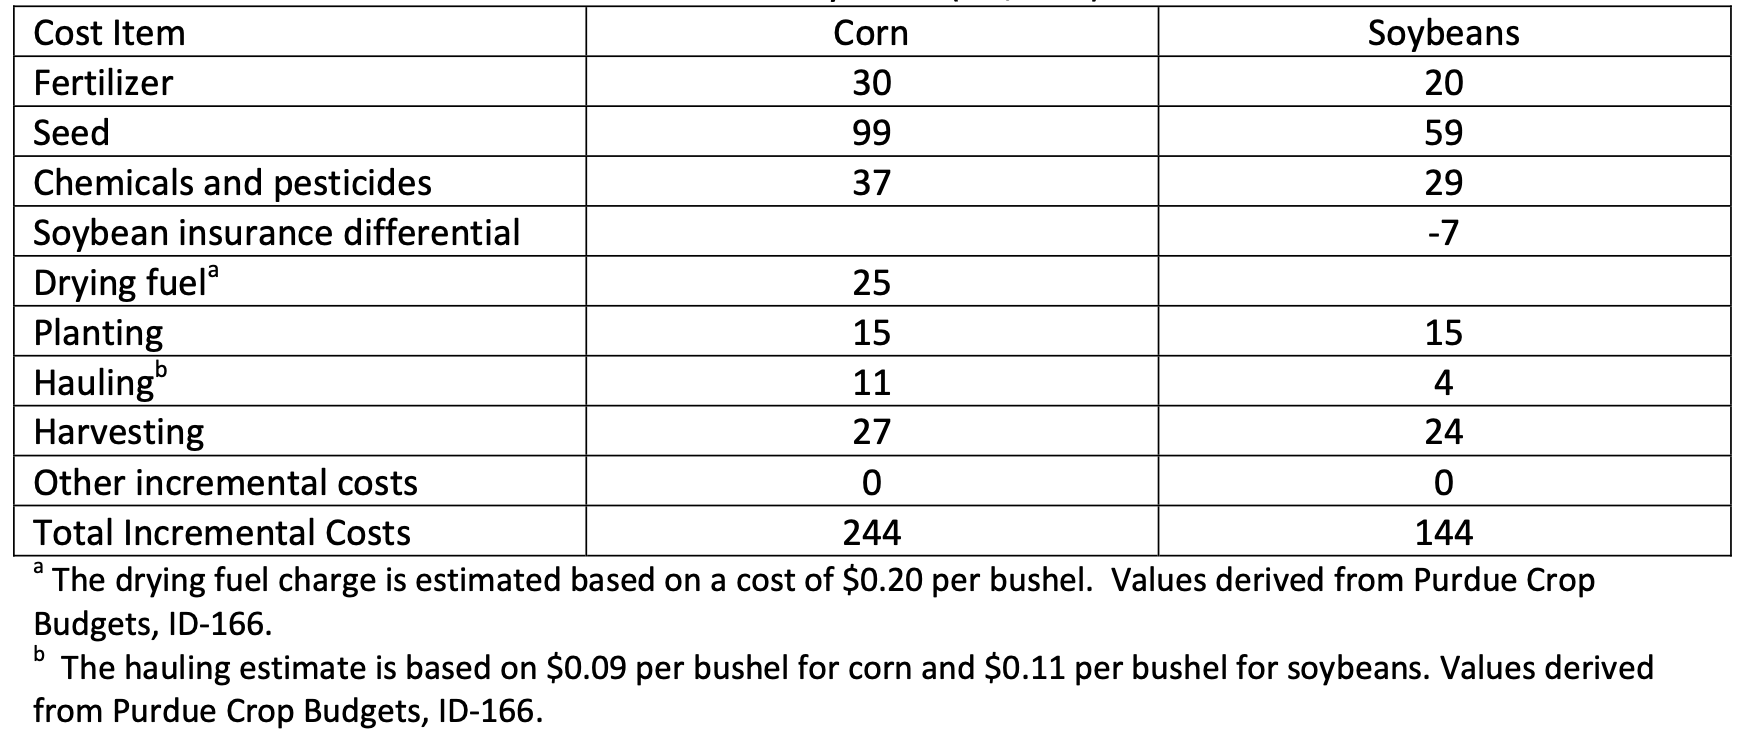
Table 3. Incremental Costs to Produce Corn or Soybeans ($’s/acre).
Determining the values in Table 3 is a critical component of the analysis. There are a few important points to consider. In the case illustrated the incremental fertilizer cost is relatively low for corn under the assumption that a significant amount of nitrogen fertilizer was applied in the fall. This means that a relatively small amount of fertilizer is still required to produce the crop. Because Nitrogen that has already been applied is essentially unrecoverable, its application is an incremental cost. If one is able to recover this value, or it had not yet been applied, the fertilizer cost should be increased accordingly because application and use of this fertilizer is an incremental cost. In other words, if the fertilizer has been prepaid but not applied the fertilizer cost for corn should be increased.
The analysis makes a negative cost adjustment to the soybean column to account for the fact that the crop insurance premium will be reduced if soybeans instead of corn are planted. The fact that crop insurance has been purchased for the corn crop does not influence its incremental costs. This cost will be incurred whether the crop is planted or not. If additional field operations are required for either crop, these costs should also be included in the analysis. The total costs of planting the corn crop are greater than that of planting the soybean crop. This is driven in large part by higher fertilizer, seed, chemical, and drying costs for corn. These costs should then be subtracted from the incremental revenues to determine the attractiveness of the options.
The next step in the analysis is to calculate the incremental revenue that is associated with each of the alternatives. The key components in this analysis are crop insurance revenues and crop sales. In order to calculate the potential crop insurance indemnity payments, one must first recalculate the revenue guarantee to reflect the situation that planting took place after the planting deadline. The revenue guarantee declines by 1% per day that the crop is planted after the deadline, up to 25 days. The modified crop revenue guarantee is then compared to the crop insurance calculated revenue to determine if a crop insurance indemnity is due. This is illustrated in Table 4.
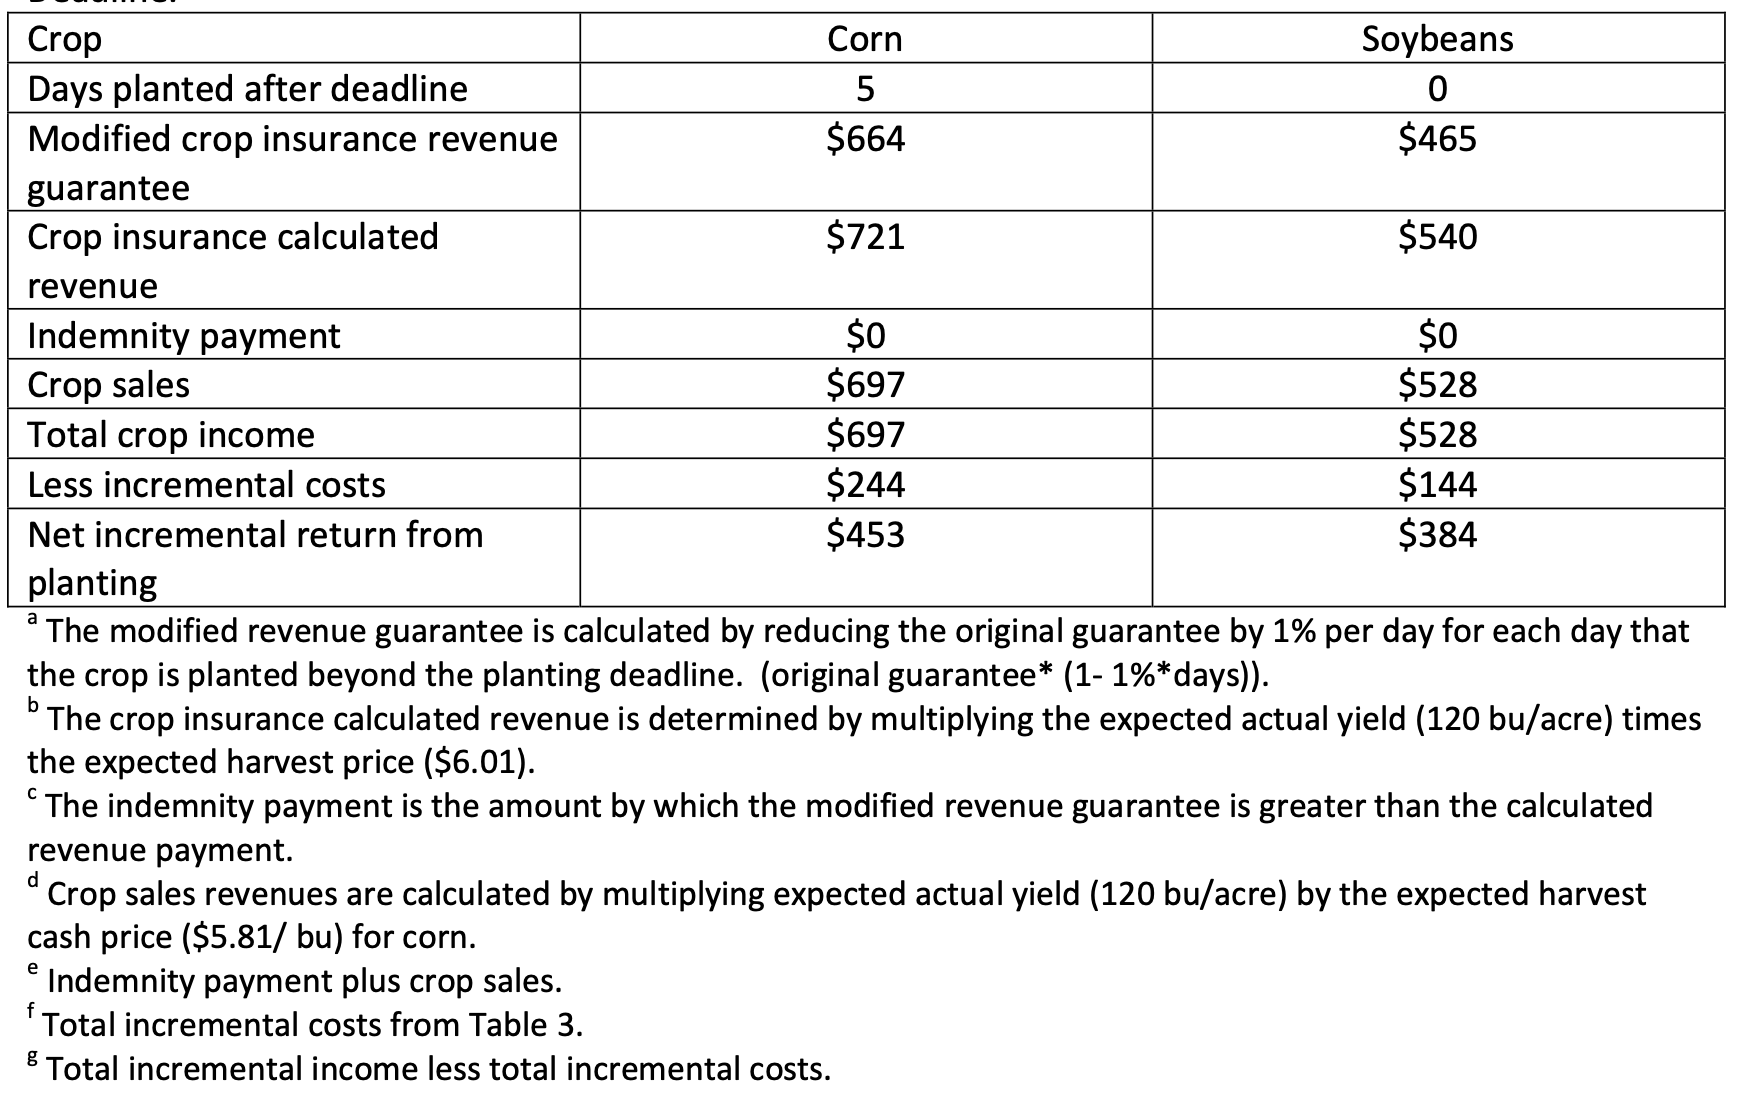
Table 4. Revenue Protection Crop Insurance Indemnity and Income Calculation for Crops Planted after Deadline.
The next step is to calculate the actual crop revenues and net incremental costs. The total crop revenues are determined by adding the indemnity payment to cash crop sales. Finally, the incremental costs from Table 3 are subtracted from the revenues to determine the net incremental benefit from planting the crops.
The three alternatives are summarized in Table 5. In this case the incremental benefit from planting corn is $453 per acre which is greater than the incremental benefit from producing soybeans ($385 per acre). Under this scenario planting corn would be preferred to accepting the prevented planting payment of $394 per acre or switching to soybeans.

Table 5. Summary of the Expected Incremental Benefits of the Three Alternatives in this Scenario.
One should be careful to realize that the assumptions about the level of costs, yields, prices, and coverage levels will have an important impact on the decision. In short, do not generalize this simple illustrative scenario to your operation. Instead, enter the specifics of your situation in the spreadsheet to make a better decision. If incremental fertilizer costs were higher for corn, it would shift the decision toward accepting the prevented planting payment. Additionally, if soybean yields are estimated to be higher, soybeans will be more attractive. In this particular scenario, corn yields have little impact on the decision as lower yields are quickly offset with higher crop insurance indemnity payments. Likewise, if harvest prices increase, the revenue guarantee will increase making planting corn more attractive. This occurs because the prevented planting payment does not increase with crop price increases.
Effects of Alternative Prices, Yields, and Costs
The impact of alternative price, yield, and cost scenarios are examined in Tables 6‐9. Tables 6 and 7 show the net incremental return from corn production under two alternative cost structures. The shaded cells in these tables indicate that the returns for various price and yield combinations are greater than the returns from accepting the prevented planting payment. In Table 6 $244 of incremental costs are required to produce the crop, and in Table 7 the incremental costs are increased $100 per acre. One can quickly observe that in the lower cost scenario (Table 6) planting corn is desirable over accepting the prevented planting payment. Here, all entries are greater than the prevented planting payment. If higher yields or prices are obtained the differences can be substantial.
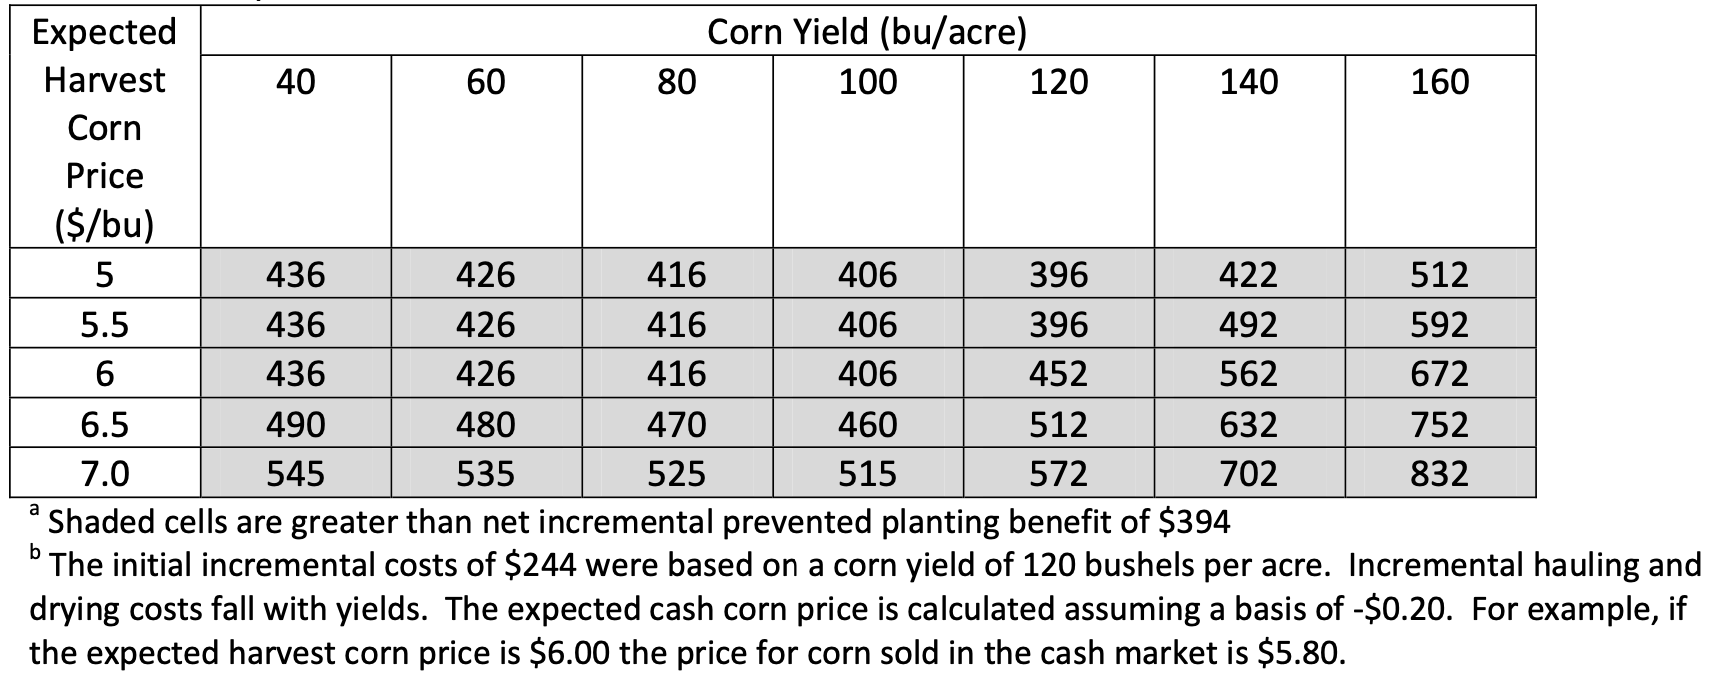
Table 6. Net Incremental Return to Corn under Various Yield and Price Scenarios and Incremental Corn
When the incremental costs increase by $100 per acre (Table 7), the results are less favorable for planting corn. Unless prices were to rise dramatically, yields typically have to be in excess of 120 bushels per acre to exceed the prevented planting payment.
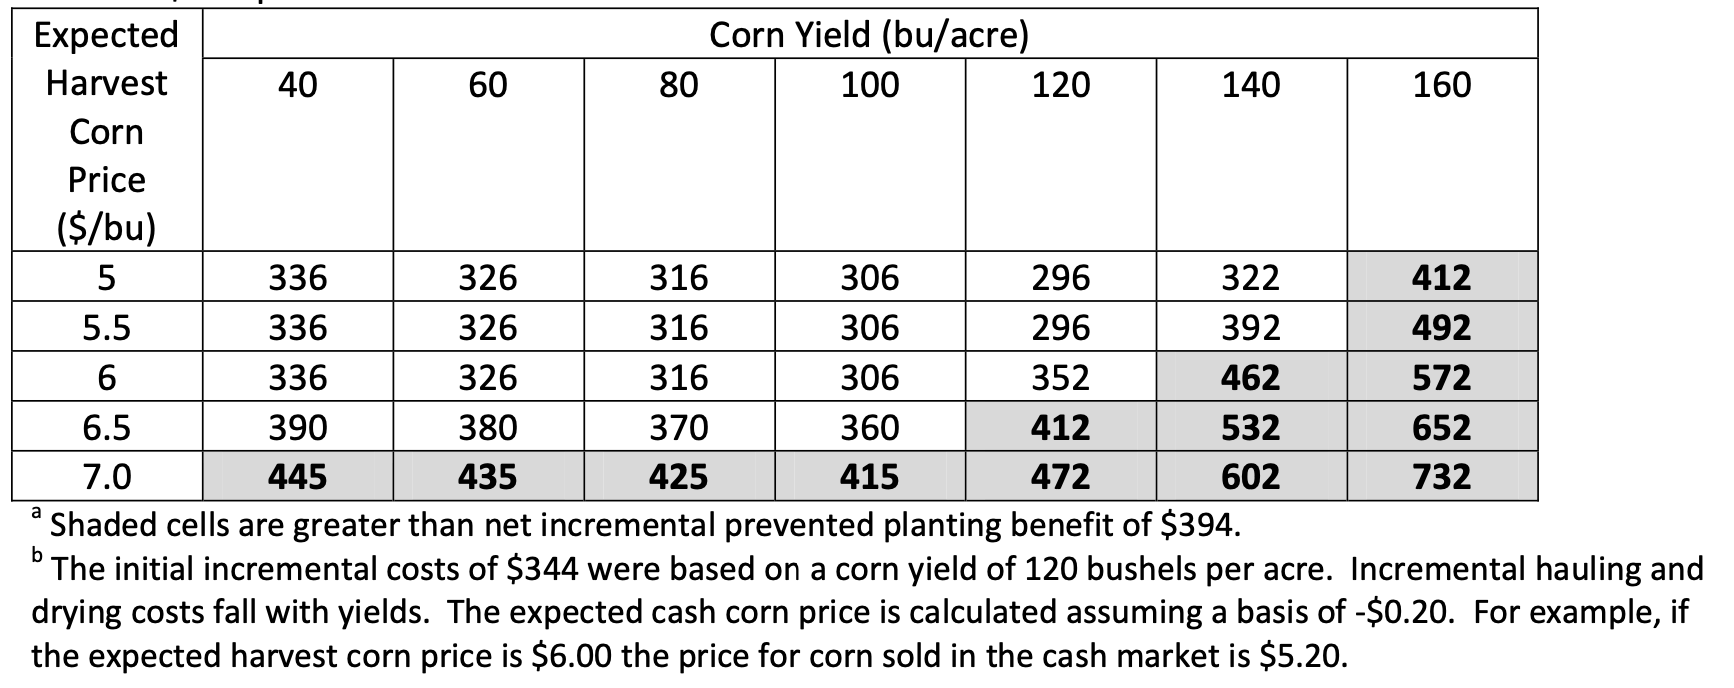
Table 7. Net Incremental Return to Corn under Various Yield and Price Scenarios and Incremental Corn
The other alternative is to plant soybeans. Again, two cost structures are examined. Table 8 shows the lower cost structure and 9 the higher. For these levels of incremental costs, soybean yields must be above 40 bushels per acre to make this option preferred to taking the prevented planting option. If soybean yields are high, then the benefit of switching to soybeans can be substantial. If one compares these returns to the alternative of planting corn, one would likely need to expect a relatively high soybean yield and high incremental corn cost situation to prefer planting soybeans to corn.
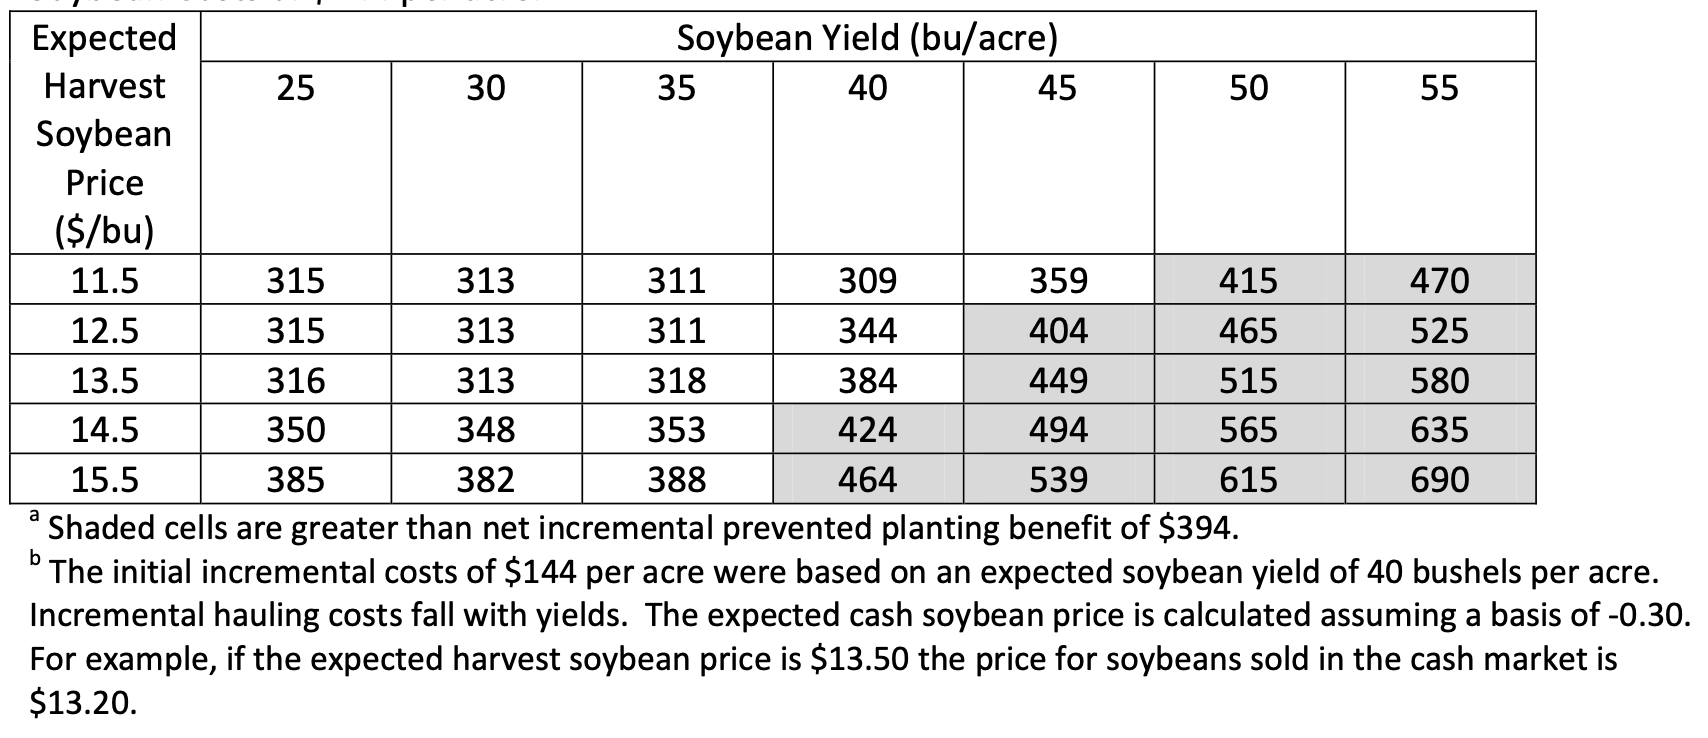
Table 8. Net Incremental Return to Soybeans under Various Yield and Price Scenarios and Incremental
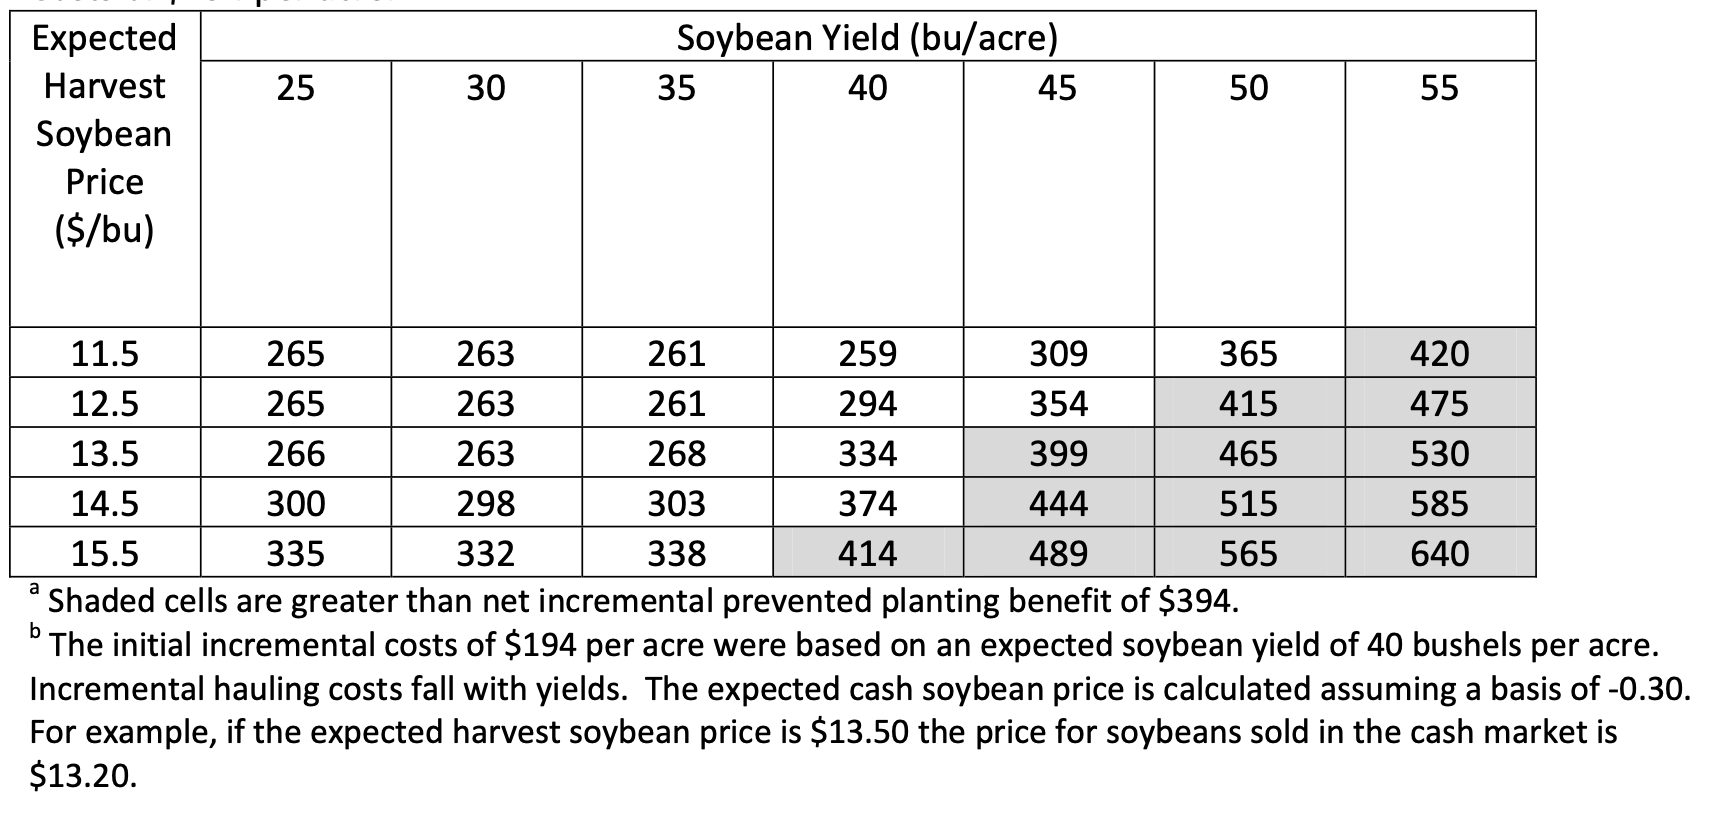
Table 9. Net Incremental Return to Soybeans Various Yield and Price Scenarios and Incremental Soybean
Final Thoughts
Many farmers in the Eastern Corn Belt are significantly behind schedule in corn planting and are approaching the final planting date of June 5. The yield or revenue guarantee for corn planted in Indiana after June 5 is reduced 1% per day, up to 25%. Producers who were unable to plant corn by June 5 may be eligible for a prevented planting payment. This payment is 60 percent of the yield or revenue guarantee. Alternatively, a producer can plant corn during the late planting period or shift to soybeans.
A simple partial budget analysis is performed looking at the incremental costs and returns of these alternatives. The prevented planting payment generally provided a higher return for producers who faced large incremental costs to corn planting. In situations where incremental costs for planting corn were lower, planting corn will likely be attractive. Here, because crop insurance payments compensate for some yield reductions and revenue guarantees would increase with any harvest price increases there is a greater incentive to plant corn. The type and coverage level of crop insurance plays a key role in the decision. Because a wide variety of factors influence the attractiveness of the decision, farmers need to consider their own individual situation in evaluating the decision. The proper economic decision will depend upon the specific conditions facing each farmer.
**The spreadsheet used is this analysis can be used to conduct your own analysis of the situation and is available at: https://ag.purdue.edu/commercialag/home/wp-content/uploads/2011/05/2011_05_31_Gloy_Economics_Prevented_Planning.xlsx
![]()
![]()
![]()
![]()
![]()
TAGS:
TEAM LINKS:


RELATED RESOURCES
UPCOMING EVENTS
We are taking a short break, but please plan to join us at one of our future programs that is a little farther in the future.