January 8, 2013
The Wealth Effect in U.S. Agriculture
![]()
![]()
![]()
![]()
![]()
Since 2009, wealth in the U.S. farm sector has surged along with booming farmland values. Similar to nonfarm households, farm enterprises historically have used wealth to support consumption and investments when income fades. During years of low income, farmers tap their existing wealth to finance spending on capital investments such as buildings, vehicles, machinery and other equipment. Thus, similar to nonfarm households, the wealth effect often leads to sharp increases in debt and leverage in farm enterprises.
Historically, the sharp accumulation of debt has preceded financial crises. After farm booms in the 1910s and 1970s, lower incomes and higher interest rates contributed to farm financial crises and waves of farm bankruptcies during the 1920s and 1980s. Rising bankruptcies and the resulting deleveraging in agriculture echoes the recent financial crisis which was characterized by home foreclosures and lost housing wealth.
In 2013, historically high farm incomes are projected to keep U.S. farm debt and leverage low. Yet, longer-term projections suggest that farm incomes could fall dramatically in 2014. If agriculture’s historical wealth effect holds true, farm enterprises might use existing wealth to finance and smooth investment spending, sowing the seeds for another round of debt accumulation.
The Historical Wealth Effect in U.S. Agriculture
For U.S. agriculture, the wealth effect is fairly strong as capital investments fluctuate with farm wealth and equity. Similar to home real estates where surging stock and home prices during the 2000s fueled increases in personal consumption, rising land values historically have supported stronger farm investments even with lower incomes.1 Historically, as farm booms matured and farm profits faded, high equity values underpinned farm capital investments.
Conceptually, the wealth effect emerges as farm households and enterprises use wealth to finance investments over time (Boumtje, Barry and Ellinger; Langemeir and Patrick). Farm enterprises are assumed to allocate profits between current investment and retained equity. Farm investments depend on the total resources of the enterprise—profits and wealth. During less-profitable times, instead of allowing investments to fall with profits, farmers tap their existing wealth to finance and maintain their capital investments near previous levels. In addition, absent financial market stress, lenders also can contribute to the wealth effect by being more willing to lend to farm enterprises that have greater levels of equity to use as collateral for loans.
Regression analysis reveals that shifts in farm investments and capital expenditures in the U.S. farm sector were found to rise and fall with farm equity.2 Using data from 1910 to 2011 and controlling for other factors that also shape farm investments, such as farm profits and interest rates, the regression analysis found that farm capital investments fluctuated with shifts in farm wealth. 1–percent increase in farm equity was associated with a 0.9–percent increase in total farm capital expenditures. The regression analysis shows that farm wealth has a slightly stronger relationship with capital expenditures on real estate investments than non-real estate investments. For example, a 1–percent rise in farm equity was associated with a 1.2–percent increase in real estate capital expenditures on structures and land improvements compared to a 0.8–percent rise in non-real-estate capital expenditures on vehicles, machinery and equipment.
The clearest example of the importance of the wealth effect on U.S. farm capital expenditures is seen in the 1970s. In 1972, a surge in U.S. exports, underscored by a Russian grain trade deal, led to a doubling of U.S. crop prices and a spike in farm profits. In 1973, the real net returns to farm operators spiked to almost $50 thousand per farm, almost double the previous year’s level (Chart1). Although farm profits quickly retreated, farm capital expenditures continued to rise 5.8percent per year for the average farming operation through the rest of the decade. To upgrade their equipment and machinery, farmers accelerated their investments on vehicles, machinery and equipment. Farmers also increased their investments in structures and land improvements. In fact, capital spending did not peak until 1979, when it reached $20,000 per farm, double the 1970 level and six years after the spike in farm profits.
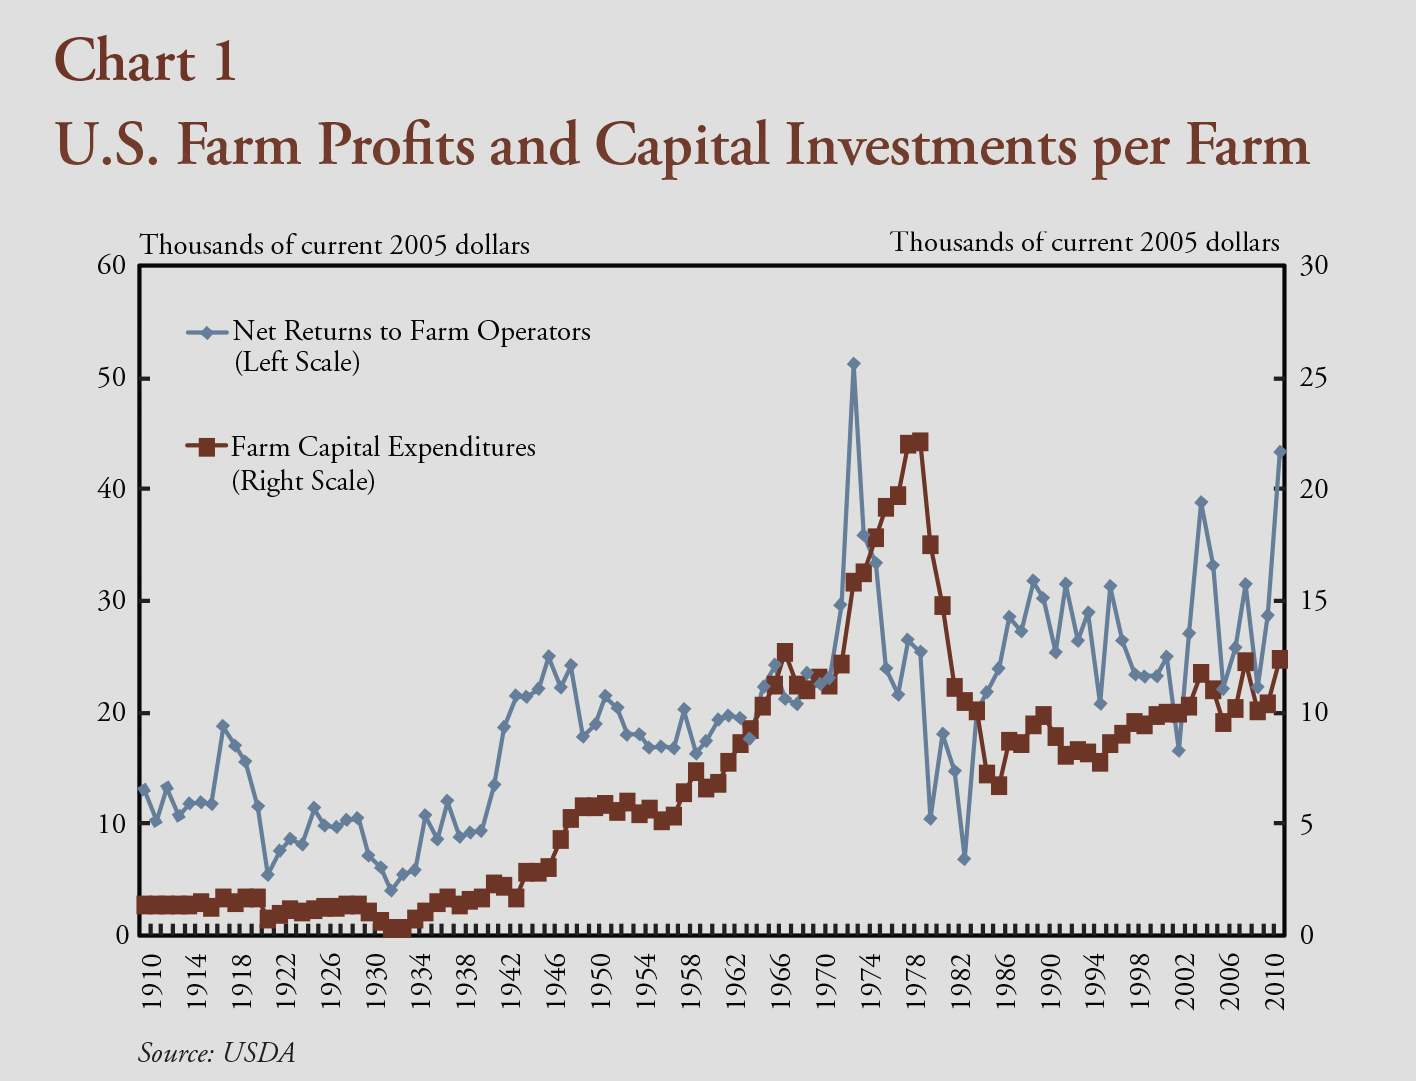
Chart 1. U.S. Farm Profits and Capital Investments per Farm
Today, U.S. agriculture appears to be in the initial stages of another farm investment cycle. Since 2006, a doubling of U.S. agricultural exports and strong biofuels demand has pushed annual real returns to farm operators above $45,000 per farm, the highest level since 1973. Rising profits have spurred capital investments to the highest level since the 1970s with real capital expenditures per farm topping $12,000 per year in 2011.
Although farm investment has accelerated, farmers generally appear to have been conservative in their capital investments, at least when compared with past farm booms. After adjusting for inflation, average annual farm capital expenditures per farm have been lower than 1970s levels. In addition, farm capital expenditures now account for a smaller share of farm profits than past farm cycles. Over the past two decades, average annual farm capital expenditures have equaled roughly 40 percent of average annual returns to farm operators, down from 80 percent during the 1970s farm boom. However, farm capital expenditure data is only available through 2011 and farmers, especially crop producers, earned record high profits and enjoyed record wealth gains due to rising farmland values the past two years. With the Association of Equipment Manufacturers reporting historically high tractor and combine sales in 2012, farm capital investments may have strengthened further.
Leverage Cycles in U.S. Agriculture
Because the wealth effect underpins farm capital investments as farm profits fade, the wealth effect also leads to an accumulation of farm debt and leverage in U.S. agriculture. The leveraging of U.S. agriculture was most pronounced during the 1910s and 1970s, which preceded farm financial crises during subsequent decades. Similar to capital investments, debt accumulation comes in waves. Real estate debt rises first, followed by rising non-real-estate debt.
Since 1900, real farm debt has fluctuated widely, shifting with farm profits and wealth. In the initial stages of past farm booms, farm debt accumulation slowed as farmers used rising incomes to pay debts and finance capital investments. During World War I, despite sharp increases in capital spending by farmers, farm debt fell 13 percent between 1916 and 1919 with booming profits (Chart 2). During the 1940s, record high farm profits contributed to a 33–percent decline in farm debt between 1940 and 1948. During the 1970s, a spike in farm profits during 1973 slowed farm debt accumulation to 2 percent per year in 1974 and 1975 after rising more than 6 percent during the rest of the decade.
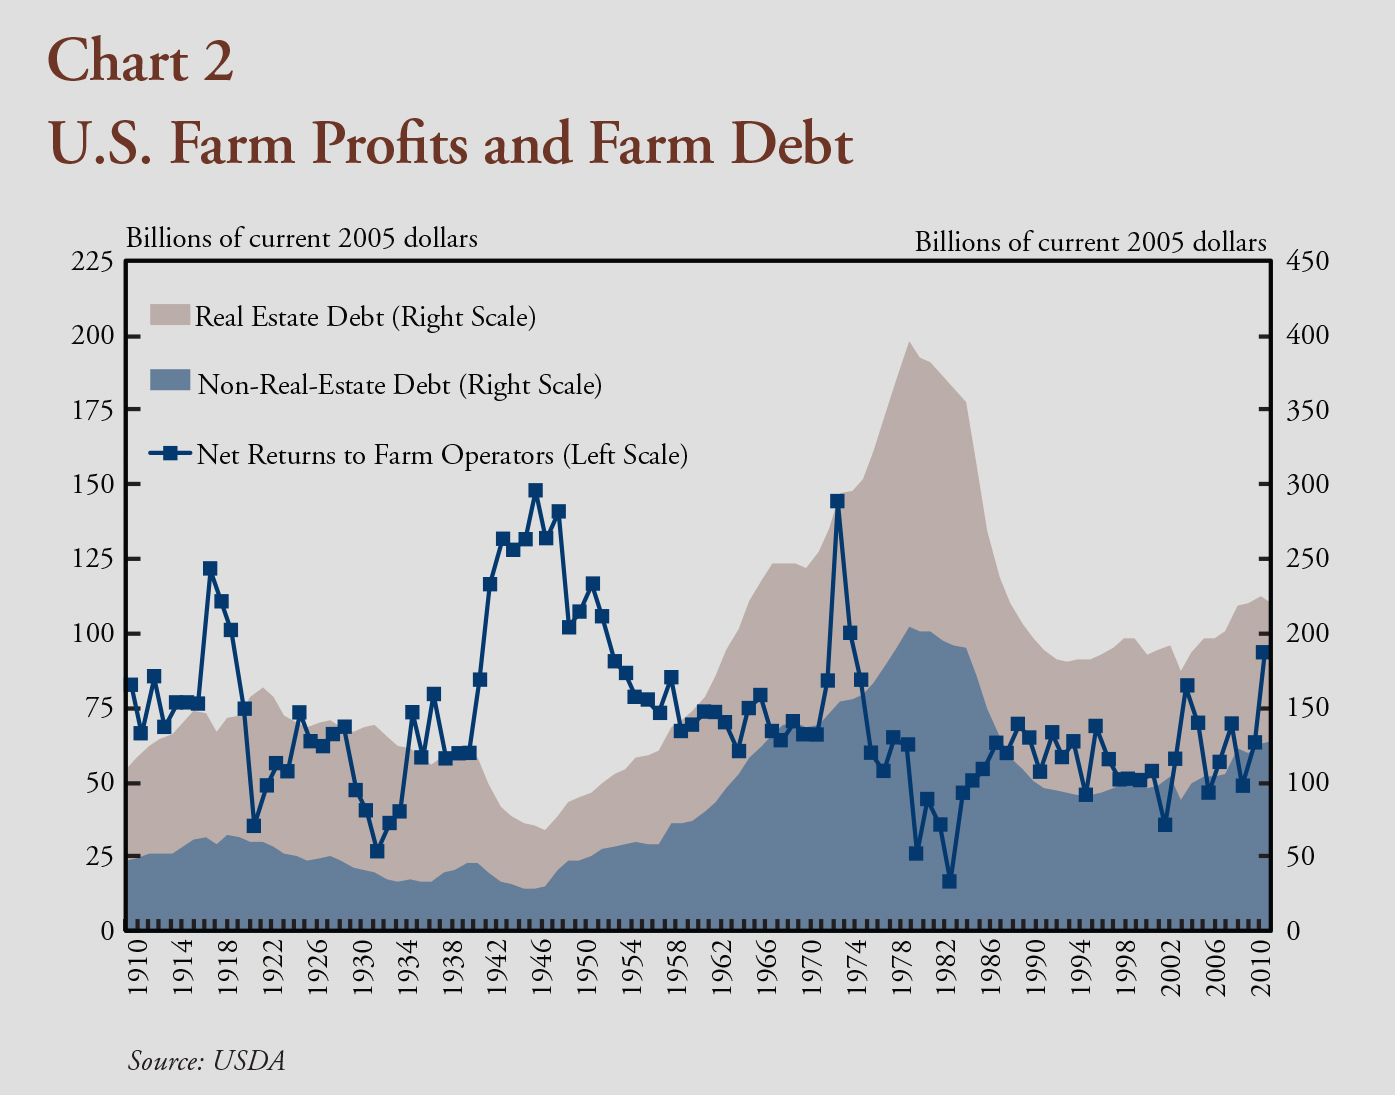
Chart 2. U.S. Farm Profits and Farm Debt
Yet, as farm booms matured and farm profits began to fade, farm debt rose. With falling profits, farmers initially took out debt to smooth their capital investments. After incomes peaked in 1919, farm debt jumped 14 percent per year over the next three years. Similarly, after farm profits declined in 1949, farm debt surged by a third in 1950 and steadily increased over the next decade amid lower farm profits. In the 1970s, lower farm profits toward the end of the decade again were associated with rising farm debt between 1976 and 1979, farm debt rose 7.5 percent per year. Not surprisingly, farm debt is negatively correlated with farm profits. Rising profits reduce debt, while lower profits contribute to higher debt levels.
Farmers also accumulate more debt when wealth levels are high. High wealth levels increase the amount of collateral available to underpin farm borrowings. Using simple correlations, farm debt was higher in periods with high farm wealth, and the strength of the relationship did not vary by type of farm debt.3 In a regression controlling for profits, a 1–percent increase in Farm wealth was associated with a 1.24–percent increase in farm debt.4 Farm wealth had a stronger association with non-real-estate debt than real estate debt. A 1–percent increase in farm wealth was associated with a 1.38–percent increase in non-real-estate debt compared with a 1.13– percent increase in real estate debt.
Today, an increase in farm debt may signal the beginning of another turning point in farm debt and leverage. After rising less than 1 percent annually since 2008, farm debt outstanding at commercial banks rose roughly 5 percent in the fourth quarter of 2012 for both real estate and non-real-estate debt. Similarly, Farm Credit System lending for real estate mortgages and production and intermediate-term loans rose 5.7 percent during 2012.
The Risks to Farm Wealth
Past cycles in U.S. agriculture suggest that U.S. farm booms go bust when leverage ratios and farm bankruptcies spike. Although rising debt levels are an important contributor to farm solvency issues, sharp declines in farm real estate values, which slash farm assets, have been the primary trigger of farm insolvency and bankruptcy. The prospects of lower farm incomes and higher interest rates in the future raise concerns about future farm wealth.
After posting record highs the past two years, long-term projections suggest U.S. farm profits are expected to retreat over the next decade. With a return to more normal weather patterns, a rebound in U.S. crop production is expected to expand inventories and reduce crop prices by 2014. At the same time, stronger global crop production and slower demand growth from exports and ethanol is projected to weigh on crop prices and profits. For example, after averaging $580 per acre for the past two years, the USDA projects net returns above variable costs for corn production to fall below $350 per acre by 2014, a decline of 44 percent (Westcott and Trostle). Sizeable declines also are projected for profitability in other crop production. When combined with other types of agricultural production, the USDA projects U.S. net farm incomes to fall 20 to 25 percent below 2013 highs during 2014 and remain near these levels over the next decade.
In addition, the Federal Reserve suggests that interest rates could begin to rise during this period of lower incomes. Currently, most of the Federal Open Market Committee (FOMC) members of the Federal Reserve System also indicate that keeping the fed funds rate below 1 percent is the appropriate policy response through 2014 (Federal Reserve). However, there is less consensus on future interest rate policy, as some FOMC members indicate that the fed funds rate should rise above 3 percent by 2015.
History has shown that a combination of falling profits and rising interest rates drive farmland prices lower. Net present value theory suggests that farmland prices should equal the capitalized value of expected returns of future income streams. During the 1920s, lower farm profits and higher interest rates pushed U.S. farmland values down 25 percent, with further declines occuring during the Great Depression. During the 1980s, U.S. farmland values fell 40 percent amid lower profits and higher interest rates. Rising interest rates also raise debt service costs and are correlated with lower net farm incomes, making it difficult to determine whether interest rates or an extended period of low farm incomes will trigger land value declines.
History also has shown that when land values and farm wealth fall, solvency issues and farm bankruptcies rise. During the 1920s, U.S. farm bankruptcies spiked and remained elevated when the debt-to-asset ratio jumped above 20 (Chart 3). During the 1980s, farm bankruptcies again spiked after the debt-to-asset ratio topped 20 percent. The sharp rise in farm debt-to-asset ratios was driven by sharp declines in farmland values following the accumulation of debt in preceding years. The large declines in farmland prices and subsequent spikes in forced farm sales triggered a vicious cycle of farm bankruptcies that increased the supply of land on the market, which depressed land prices further and instigated another round of farm solvency issues and farm bankruptcies. A similar cycle occurred during the 1920s and 1930s farm bust (Alston; Stam and Dixon).
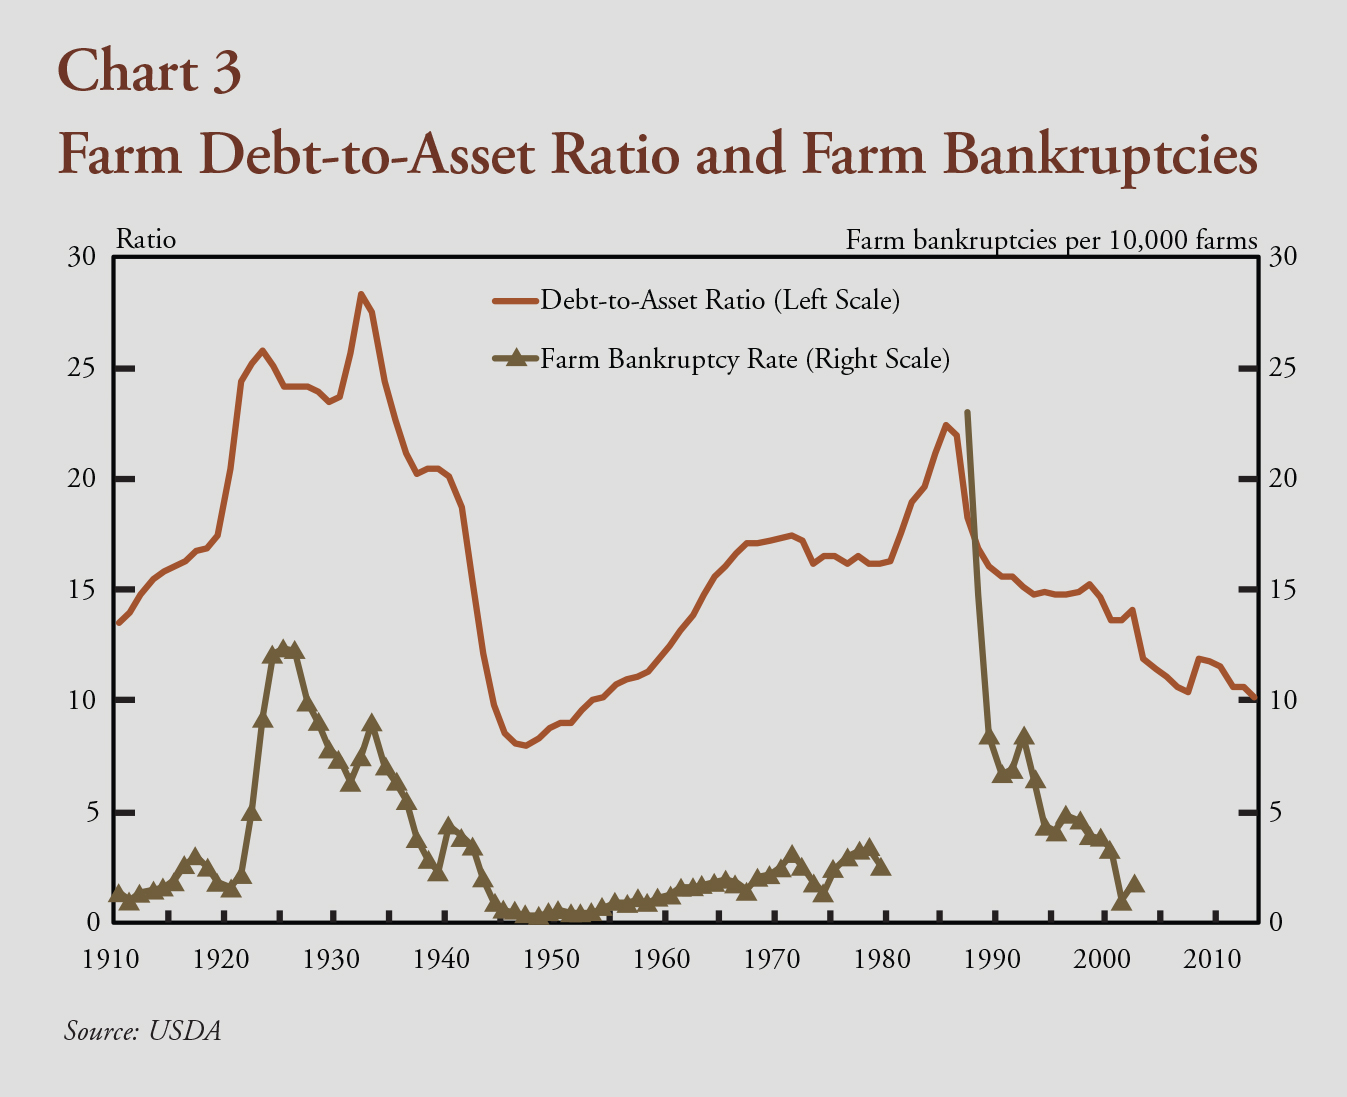
Chart 3. Farm Debt-to-Asset Ratio and Farm Bankruptcies
Although farm debt ratios remain historically low, debt accumulation on par with the 1970s could pose some future risk to farm finances. After peaking in 1973, total farm sector debt rose 43 percent or 5.3 percent per year by 1980 (Chart 4). (According to the USDA, farm sector debt rose 4.2 percent in 2012.) If farm debt were to rise 40 percent, as it did during the 1970s, a 25–percent decline in farm assets would yield a debt-to-asset ratio of 20. Similarly, if farm debt were to rise 21 percent or 4 percent annually, as it did between 1918 and 1922, farm assets would need to fall by roughly a third to push the debt-to-asset ratio above 20. Alternatively, if farm debt held steady, farm assets would need to fall by 50 percent to lift the debt-to-asset ratio above 20. The last time land values and farm assets fell this sharply was between 1980 and 1986, when farm assets fell 45 percent.
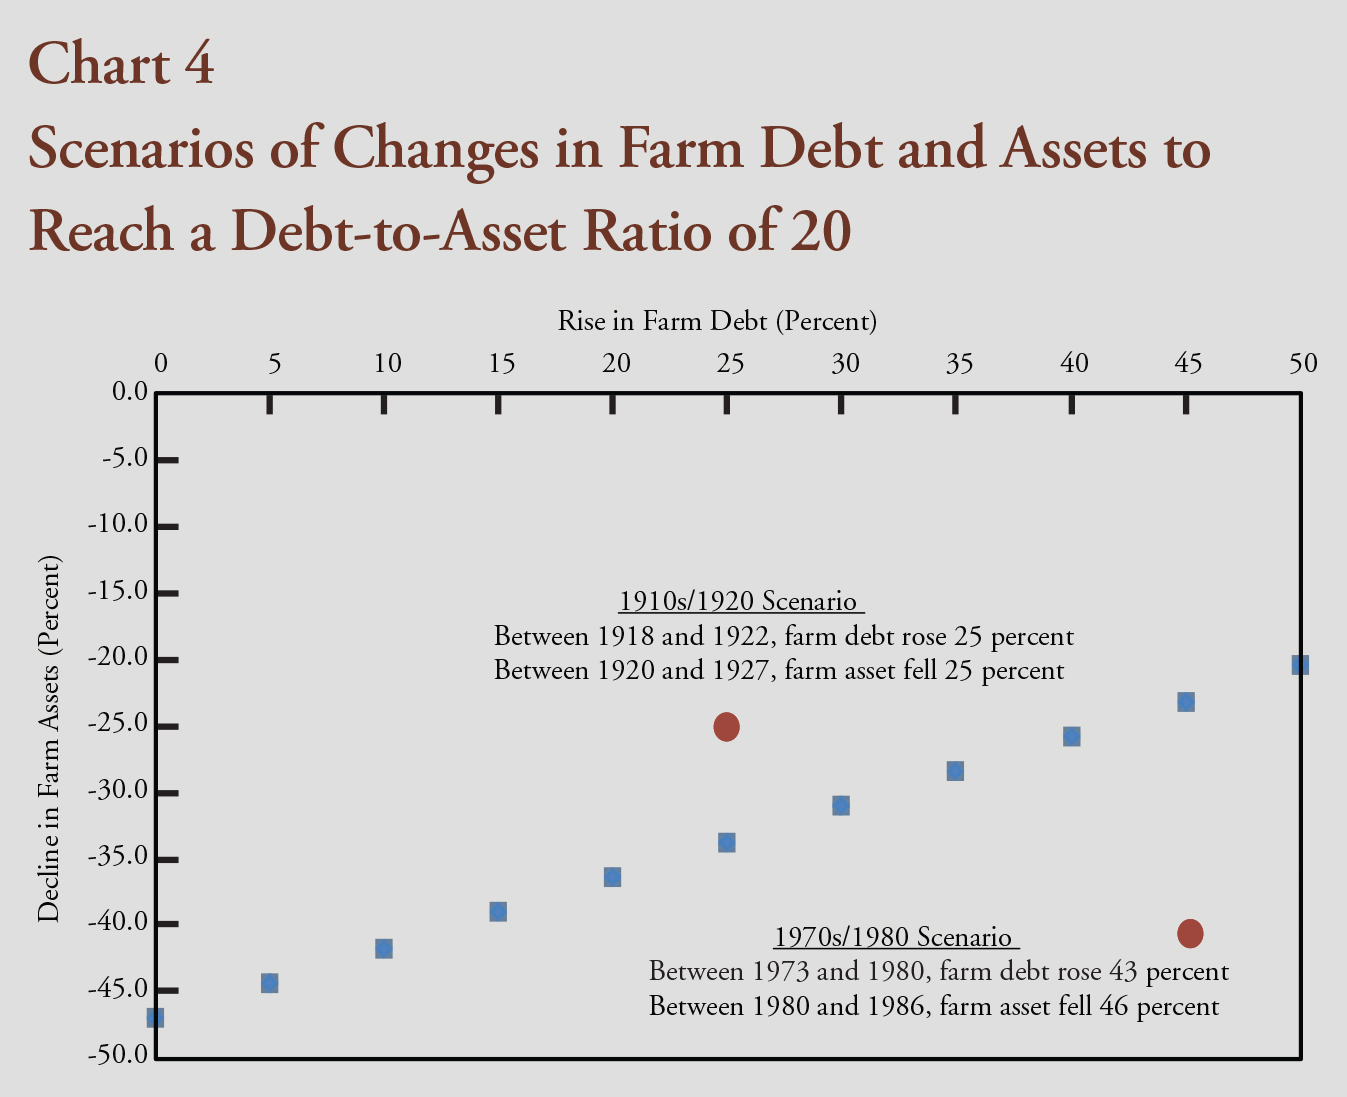
Chart 4. Scenarios of Changes in Farm Debt and Assets to Reach a Debt-to-Asset Ratio of 20
Conclusion
The stage is set for another wealth effect and leveraging cycle in U.S. agriculture. Expanding global populations and rising incomes in developing nations are boosting expectations for persistently high agricultural commodity demand. Farmers have responded by increasing production capabilities through capital investments. As a result, projections of farm profits indicate that the combination of rising supplies and higher production costs could cut farm profits by 2014.
Historically, initial declines in farm profits have not triggered a reduction in capital investments as farmers tapped their wealth to finance their capital investments. As long as farm wealth remains elevated and interest rates remain low, real estate and non-real-estate investments by farmers could continue to remain high even with lower profits. If historical precedence holds and farmers use debt instead of retained earnings to finance capital investments, the wealth effect may trigger another phase of the leverage cycle.
Current farm debt ratios remain near historical lows. Yet, projections of lower farm incomes, high wealth and low interest rates are the recipe for another wealth effect in U.S. agriculture. History has shown that significant increases in farm leverage set the stage for deleveraging cycles and farm busts if land values fall. Working capital is the first line of defense farmers can use to manage through periods of weak profitability. Whether this farm boom simply fades or busts depends on the wealth effect and how farmers finance agriculture investments.
Endnotes
1 See Davis and Palumbo; Calomiris, Longhofer, Miles for a discussion of the wealth effect of life-cycle theory and household consumption on U.S. households. See Hubbard and Kashyap for a discussion of the wealth effect in agriculture during the 1980s.
2 Analysis of the wealth effect regressed farm equity on total farm capital expenditures and expenditures on structures and land improvements and expenditures on vehicles, machinery, and equipment. The regression models also incorporated the net returns to farm operators, yield on the 10-year treasury, a time trend and a dummy variable identifying World War I and World War II to control for the effects of income, interest rates and structural changes. See Henderson and Kauffman (forthcoming) for more detailed information on the regression analysis.
3 The correlation between real farm equity and debt per farm was 0.92. The correlations between real farm equity and real estate and non-real-estate debt were 0.92 and 0.90, respectively.
4 Analysis of farm debt regressed farm equity on total farm debt outstanding and debt outstanding for real estate and non-real-estate. The regression models also incorporated the net returns to farm operators, yield on the 10-year treasury, a time trend and a dummy variable identifying World War I and World War II to control for the effects of income, interest rates and structural changes. See Henderson and Kauffman (forthcoming) for more detailed information on the regression analysis.
References
Alston, Lee J. 1983. “Farm Foreclosures in the United States during the Interwar Period,” Journal of Economic History, 43 (December), pp. 885-903.
Boumtje, Pierre I., Peter Barry and Paul N. Ellinger. 2001. “Farmland Lease Decision in a Life-Cycle Model,” Agricultural Finance Review, Fall, Vol. 61, issue 2, pp. 167-179.
Calomiris, Charles, Stanley D. Longhofer and William Miles. 2012. “The Housing Wealth Effect: The Crucial Role of Demographics, Wealth Distribution and Wealth Shares,” NBER Working Paper 17740.
Davis, Morris A., and Michael G. Palumbo. 2001. “A Primer on the Economics and Time Series Econometrics of Wealth Effects,” Finance and Economics Discussion Series, Division of Research & Statistics and Monetary Affairs, Federal Reserve Board, Washington D.C., 2001-09, January.
Henderson, Jason, and Nathan Kauffman. Forthcoming. “Farm Investment and Leverage Cycles,” Economic Review,Federal Reserve Bank of Kansas City.
Hubbard, R. Glenn, and Anil Kashyap. 1990. “Internal Net Worth and the Investment Process: An Application to U.S. Agriculture,” NBER working paper No. 3339.
Langemeier, Michael R., and George F Patrick. 1993. “Farm Consumption and Liquidity Constraints,” American Journal of Agricultural Economics, Ma y, vol 75 issue 2, pp. 479-484.
“The Livingston Survey,” 2012. Federal Reserve Bank of Philadelphia, December. Obtained Feb. 2, 2013, www.philadelphiafed.org/research-and-data/real-time-center/livingstonsurvey/2012/livdec12.pdf
Stam, Jerome L., and Bruce L. Dixon. 2004. “Farmer Bankruptcies and Farm Exits in the United States, 1899-2002.” Agricultural Information Bulletin No 788 (AIB-788), Economic Research Service, U.S. Department of Agriculture. March. http://www.ers.usda.gov/publications/aib-agricultural-information-bulletin/aib788.aspx
Westcott, Paul, and Ronald Trostle. 2013. USDA Agricultural Projections to 2022. Economic Research Service, U.S. Department of Agriculture, Outlook NO (OCE-131), February. http://www.ers.usda.gov/publications/oce-usda-agricultural-projections/oce131.aspx
![]()
![]()
![]()
![]()
![]()
TAGS:
TEAM LINKS:

RELATED RESOURCES
UPCOMING EVENTS
We are taking a short break, but please plan to join us at one of our future programs that is a little farther in the future.