September 30, 2019
Impact of Recent Changes in Corn and Fed Cattle Prices on Cattle Finishing Net Returns
by Michael Langemeier
![]()
![]()
![]()
![]()
![]()
Variability in corn and fed cattle prices has certainly been the norm in the last few months. Corn futures prices for the nearby contract were approximately $3.70 in mid-May, $4.35 in mid-July, and $3.50 in mid-September. Average fed cattle prices in Kansas for the first and second quarters of 2019 were $125.06 and $117.32, respectively, and are expected to average only $106.21 in the third quarter. This paper updates estimates made in an earlier article (here). Specifically, this paper discusses trends in feeding cost of gain, the feeder to fed price ratio, net return prospects for the next several months.
Several data sources were used to compute net returns. Average daily gain, feed conversion, days on feed, in weight, out weight, and feeding cost of gain were obtained from monthly issues of the Focus on Feedlots newsletter (here). Futures prices for corn and seasonal feed conversion rates were used to project feeding cost of gain for the next several months. Net returns were computed using feeding cost of gain from monthly issues of the Focus on Feedlots newsletter, fed cattle prices and feeder cattle prices reported by the Livestock Marketing Information Center (LMIC) (here), and interest rates from the Federal Reserve Bank of Kansas City.
Feeding Cost of Gain
Figure 1 illustrates monthly feeding cost of gain from January 2009 to July 2019. Feeding cost of gain averaged $78.10 per cwt. in 2018 ranging from a low of $74.87 in May to a high of $80.31 in December. During the first 7 months of 2019, feeding cost of gain ranged from $82.35 in January to $91.67 in March. Feeding cost of gain for July, the latest month for which data is available, was $82.61. Given current corn and alfalfa price projections, feeding cost of gain is expected to range from $78 to $82 for the rest of 2019 and the first few months of 2020. Feeding cost of gain is sensitive to changes in feed conversions, corn prices, and alfalfa prices. Regression analysis was used to examine the relationship between feeding cost of gain, and feed conversion, corn prices, and alfalfa prices. Results are as follows: each 0.10 increase in feed conversion increases feeding cost of gain by $1.43 per cwt., each $0.10 per bushel increase in corn prices increases feeding cost of gain by $0.87 per cwt., and each $5 per ton increase in alfalfa prices increases feeding cost of gain by $0.55 per cwt.
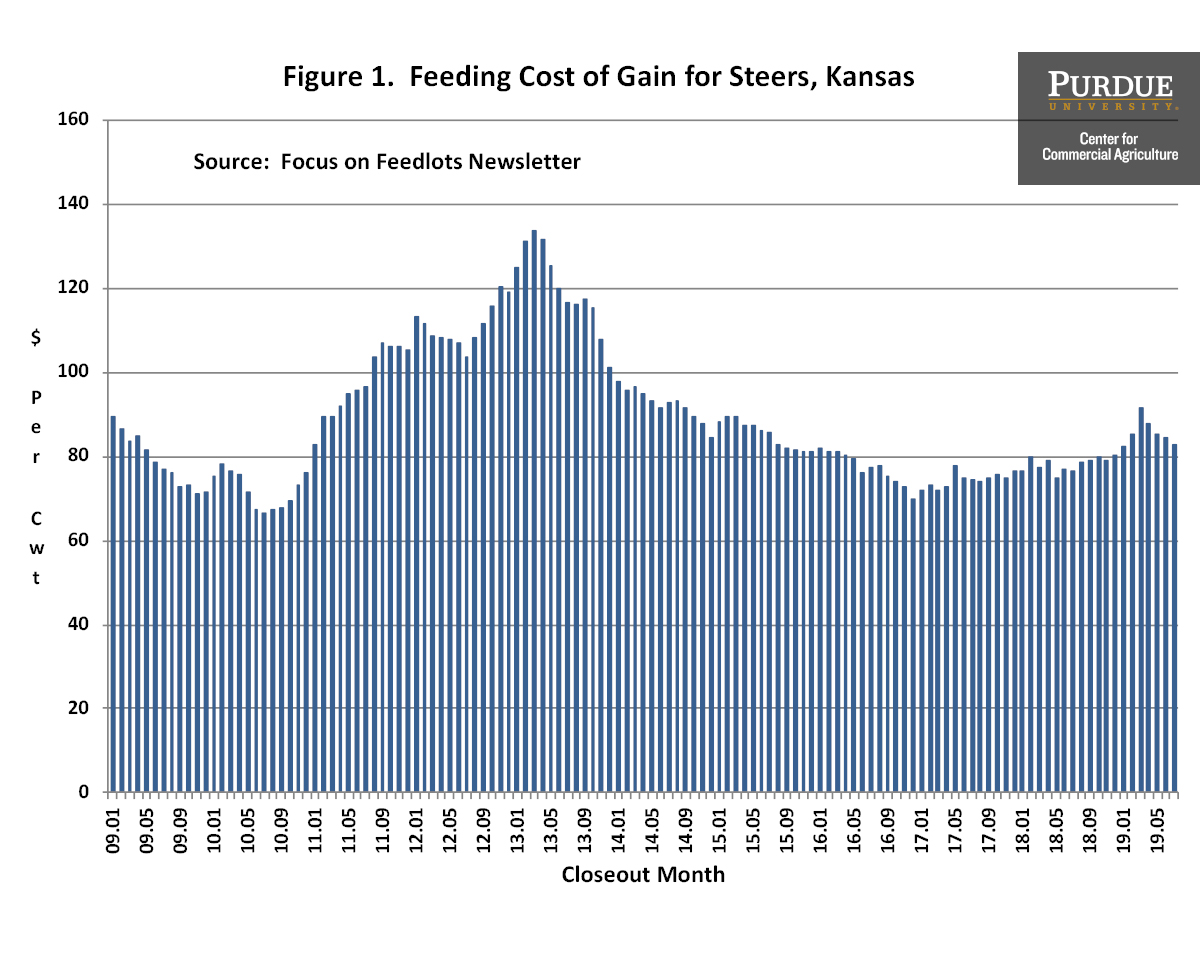
Figure 1. Feeding Cost of Gain for Steers, Kansas
Feeder to Fed Cattle Price Ratio
The ratio of feeder to fed cattle prices since 2009 is illustrated in figure 2. During the ten-year period, this ratio averaged 1.21. The feeder to fed price ratio was one standard deviation below (above) this average for 16 (18) months during the ten-year period. The average net return for the months in which the ratio was below one standard deviation of the average was $144 per head. In contrast, the average loss for the months in which the ratio was above one standard deviation was $226 per head. The average ratio for the 18 months with a feeder to fed price ratio that was above one standard deviation of the ten-year average was 1.45. The feeder to fed cattle ratio is expected to be 1.46 for September, resulting in large losses. Given current price projections, the feeder to fed price ratio is not expected to reach or exceed 1.45 for the fourth quarter of 2019 and the first quarter of 2020. However, the projected ratio for the fourth quarter is expected to be 1.31, well above the ten-year average ratio. The above average ratio for the fourth quarter has a large impact on net returns, which are discussed below. Of course, an unexpected increase in fed cattle prices would create a downward spike in this price ratio and would improve the outlook for net returns.
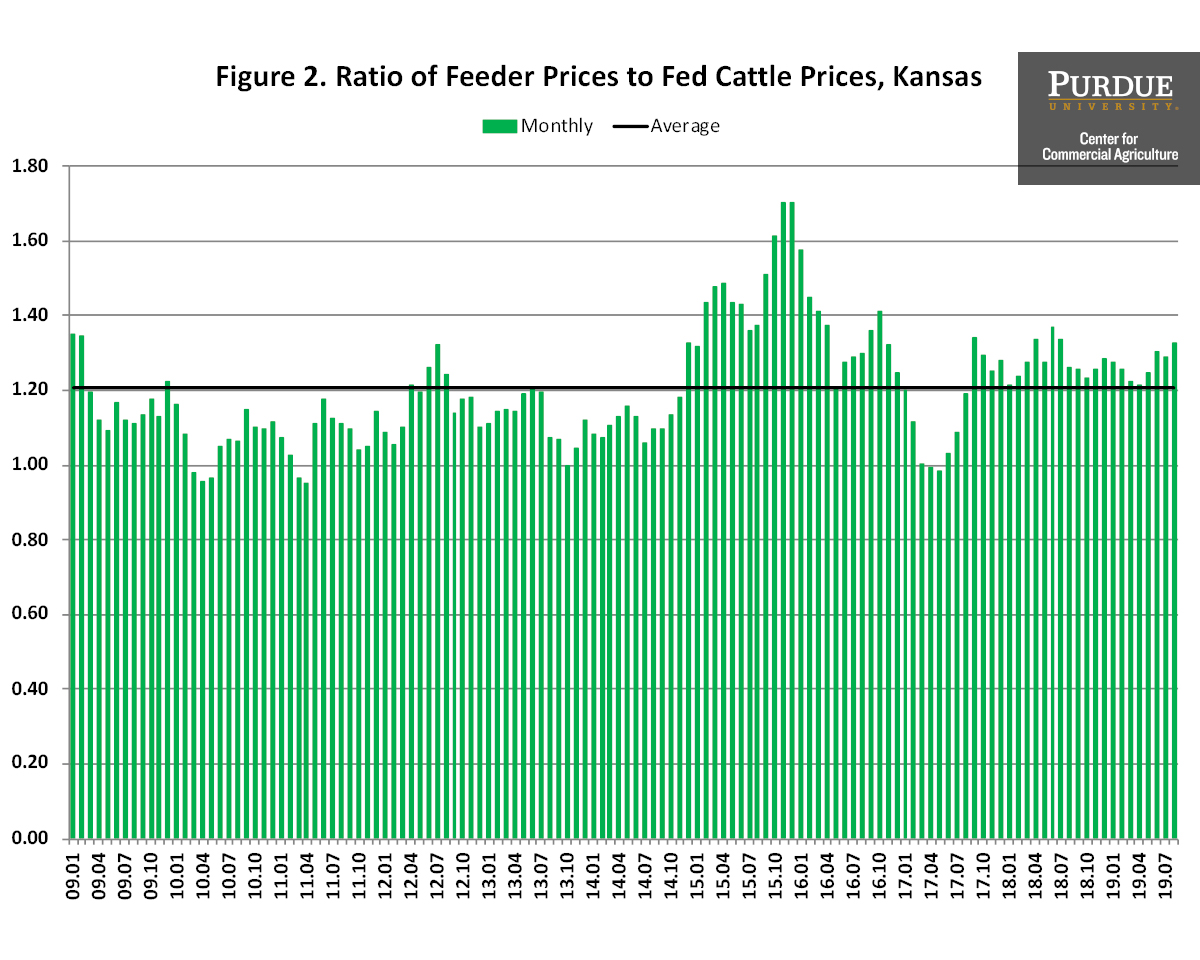
Figure 2. Ratio of Feeder Prices to Fed Cattle Prices, Kansas
Net Return Prospects
Monthly steer finishing net returns from January 2009 to July 2019 are presented in Figure 3. It is important to note that net returns were computed using closeout months rather than placement months. Net returns averaged $111 per head in 2017 and a negative $45 per head in 2018. Net losses for the first six months of 2019 averaged $52 per head. For the third quarter, net losses are expected to range from $97 in July to $275 in September, and average $180 per head.
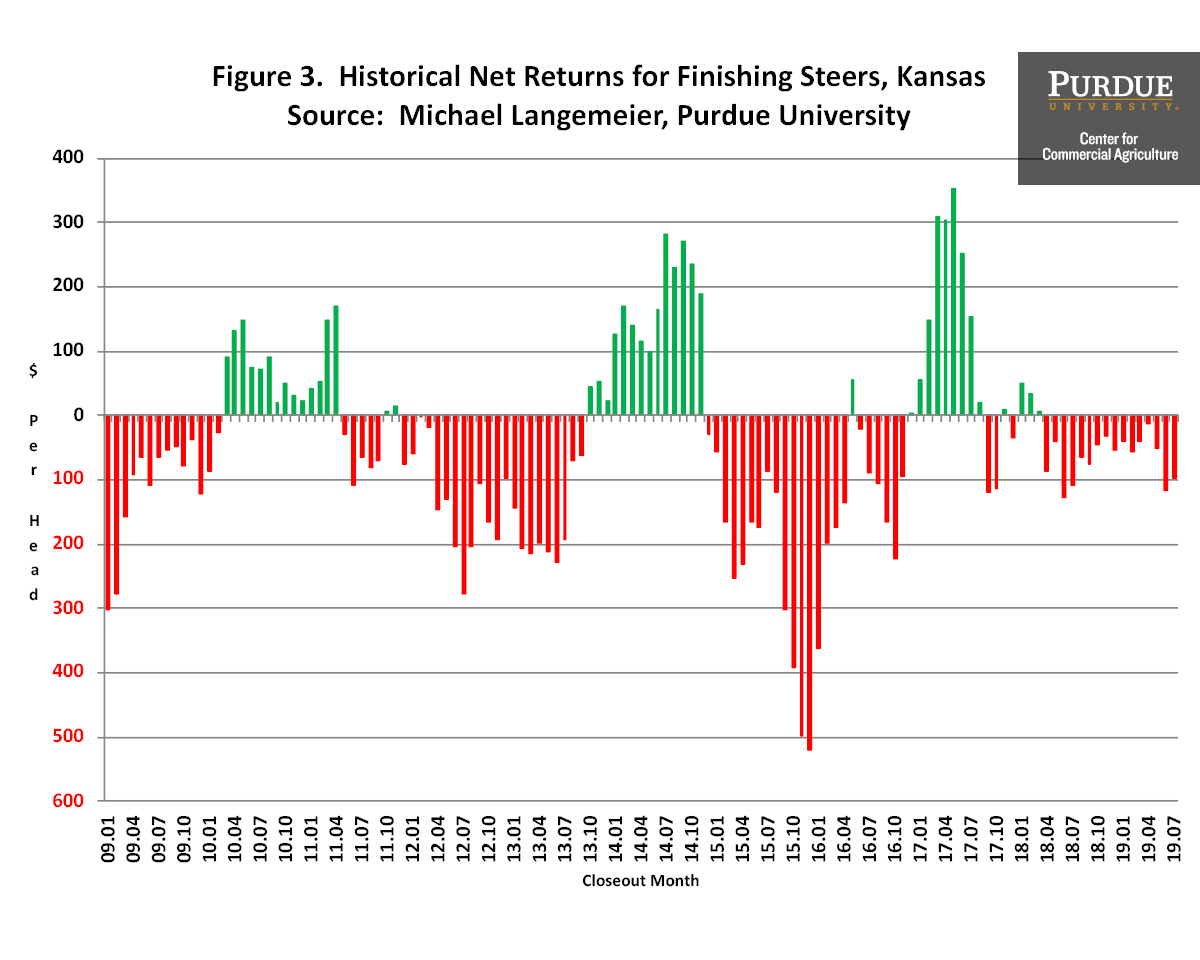
Figure 3. Historical Net Returns for Finishing Steers, Kansas
Before examining net return prospects for the next six months, we will discuss breakeven prices. Historical and breakeven prices for the last ten years, as well as projected breakeven prices for 2019, are illustrated in figure 4. Breakeven prices in the fourth quarter of 2019 and first quarter of 2020 are expected to range from $115 to $120 per cwt. with the highest breakeven prices expected to occur in December and January. Current fed cattle price projections suggest that breakeven prices during the fourth quarter of 2019 will result in average losses of approximately $150 per head. Due to higher expected fed cattle prices, net returns for the first quarter of 2020 are expected to be positive.
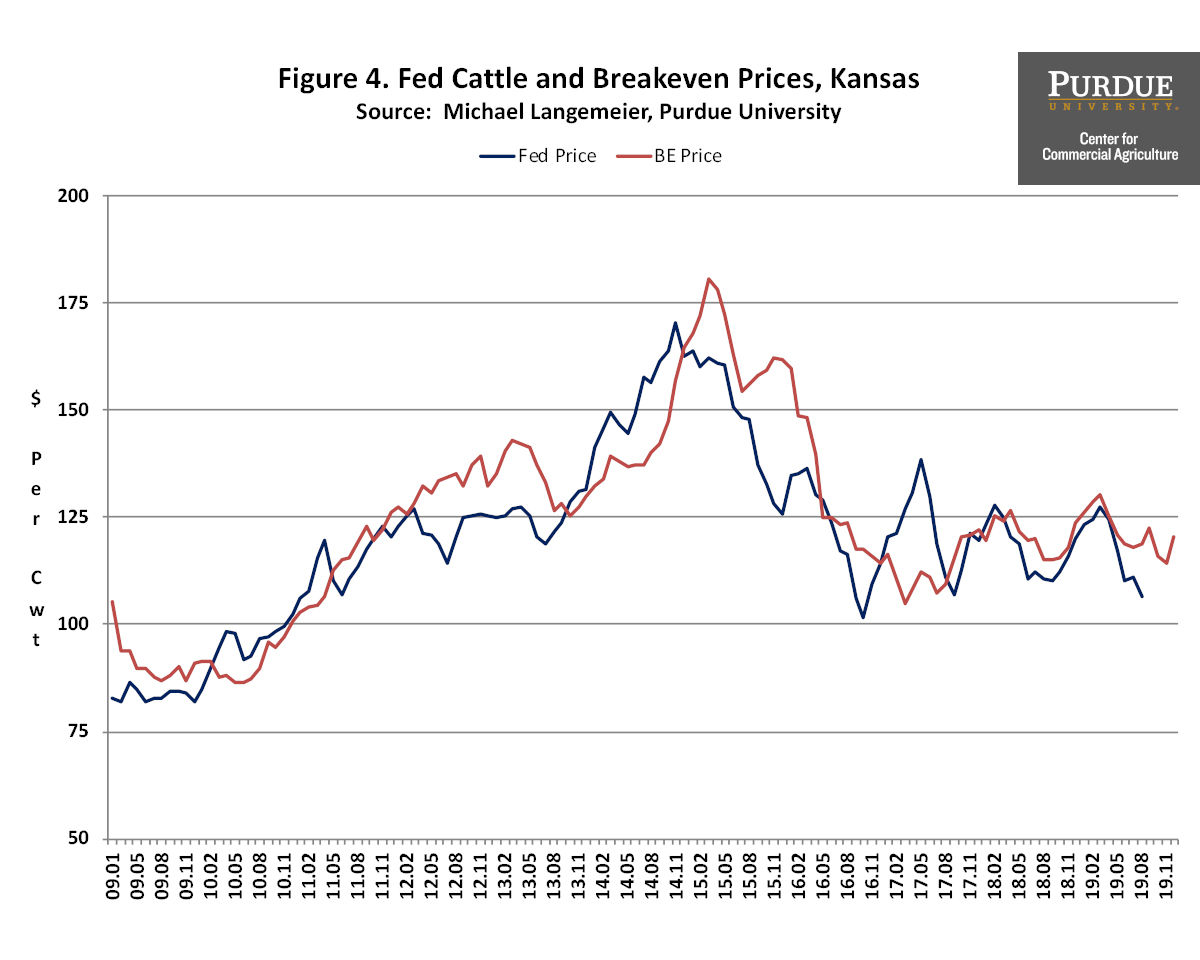
Figure 4. Fed Cattle and Breakeven Prices, Kansas
Conclusions
This article discussed recent trends in feeding cost of gain, the feeder to fed price ratio, and cattle finishing net returns. Average cattle finishing losses in the first six months of 2019 were $52 per head. Current breakeven and fed cattle price projections suggest that losses will continue for the rest of 2019 before becoming positive in early 2020. Net return projections for the next few months are primarily driven by the feeder to fed price ratio. A spike in fed cattle prices during the next three months would have a large impact on net return projections. Previous analysis suggests that each 0.01 change in the feeder to fed cattle ratio results in an $8.63 change in net returns. It is not uncommon for the feeder to fed cattle price ratio to change from 0.05 to 0.10 in consecutive months.
Citations
Focus on Feedlots, Animal Sciences and Industry, Kansas State University, www.asi.k-state.edu/about/newsletters/focus-on-feedlots, accessed March 6, 2019.
Langemeier, M. “Impact of Higher Corn Prices on Feeding Cost of Gain for Cattle Finishing.” Center for Commercial Agriculture, Purdue University, July 2019.
Livestock Marketing Information Center, www.lmic.info/, accessed March 6, 2019.
![]()
![]()
![]()
![]()
![]()
TAGS:
TEAM LINKS:

RELATED RESOURCES
UPCOMING EVENTS
We are taking a short break, but please plan to join us at one of our future programs that is a little farther in the future.