January 17, 2024
Producer Sentiment, Farmland Value Expectations, and Farm Financial Performance
Michael Langemeier and James Mintert
![]()
![]()
![]()
![]()
![]()
A previous article explored the relationship between producer sentiment and farm growth (Langemeier and Mintert, 2023). In addition to farm growth, producer sentiment is also likely related to farm financial performance and position, farmland value expectations, risk management strategies, management practices, and trade expectations. This article explores the relationship between producer sentiment, farmland value expectations, and farm financial performance.
Ag Economy Barometer
The Purdue University-CME Group Ag Economy Barometer index is computed each month to gauge producer sentiment for a group of U.S. agricultural producers (Mintert and Langemeier, 2023). The barometer’s index for August 2023 was 115 indicating that average sentiment was more positive than during the index’s base period (i.e., fourth quarter of 2015 and first quarter of 2016). The Ag Economy Barometer index is sub-divided into two sub-indices: the Index of Current Conditions and Index of Future Expectations. Index values for August 2023 for the two sub-indices were 108 for the Index of Current Conditions and 119 for the Index of Future Expectations.
Questions related to short and long-term farmland price expectations, and expected farm financial performance in the next 12 months are posed on a monthly basis. The farm financial performance question is worded as follows. As of today, do you expect your farm’s financial performance in the next 12 months to be better than, worse than, or about the same as in the last 12 months. In August 2023, 28% of the respondents expected their financial performance to be worse than the last 12 months and 14% expected their financial performance to be better than the last 12 months, with the remainder of the respondents indicating that financial performance will be about the same. The short and long-term farmland price expectation questions address whether each respondent expects farmland price in the next 12 months or the next 5 years to better than, worse than, or about the same, respectively. An index is formed for each question by computing the difference between better than and worse than and then adding the result to 100. The short-term farmland price index was 125 in August and the long-term farmland price index was 151. Every August, the barometer survey includes an additional farmland question which has the respondents rate on a scale from 1 to 9, where 1 is extremely poor and 9 is extremely good, how they would rate farmland as an investment. In August 2023, 62% of the respondents indicated that farmland is a good investment (ratings from 6 to 9), 18% of the respondents indicated that farmland is a poor investment (ratings from 1 to 4), with the remainder of the respondents having a neutral rating. Combining these responses, yields an average farmland investment index of 144.
Responses by Farmland Price Expectation Groups
The monthly Ag Economy Barometer report discusses aggregates of individual responses. It’s also possible to compute indices for various groupings of respondents using individual responses to specific questions. Table 1 contains indices for the Index of Current Conditions, the Index of Future Expectations, the Ag Economy Barometer index, the financial performance index, the long-term farmland price index, and the land investment index by short-term farmland price category. The first category includes results from respondents who said they expected farmland prices to decline in the next 12 months, while the second and third categories were derived from respondents who said they expected farmland values to remain the same or increase, respectively, during the next 12 months. This discussion focuses on the indices for each measure (i.e., within each row) that are significantly different from one another. The red indices indicate that a particular index is significantly lower than the other indices for a specific measure or row. The green indices indicate that a particular index is significantly higher.
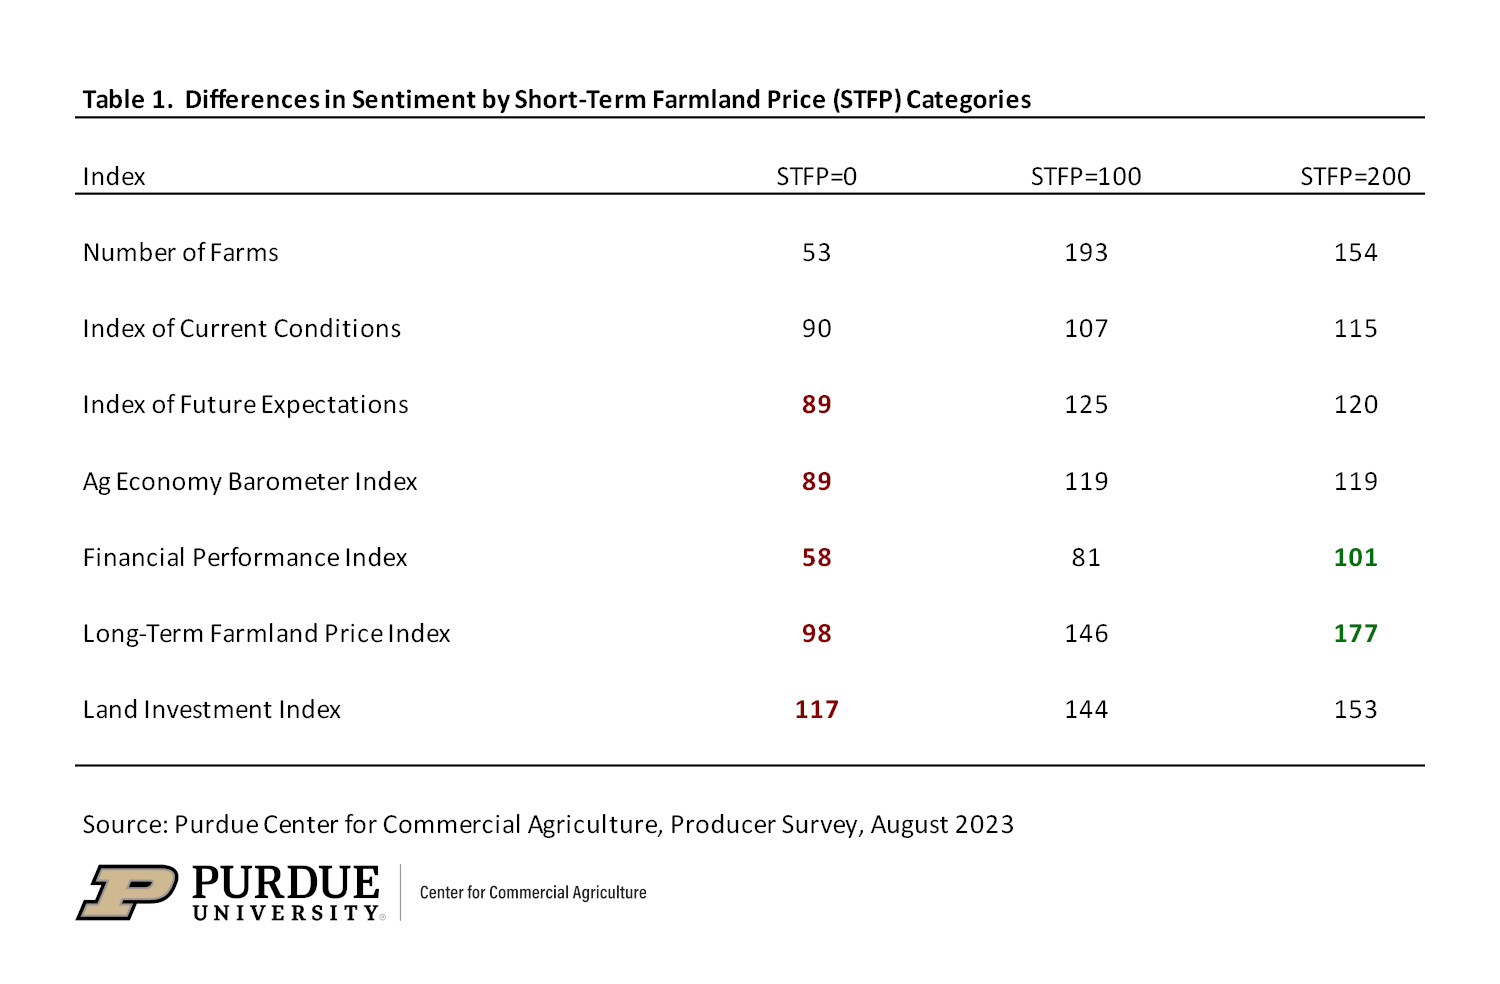
Table 1. Differences in Sentiment by Short-Term Farmland Price (STFP) Categories
Starting with producer sentiment, respondents who expect farmland prices to be lower in the next 12 months had a lower (i.e., were more pessimistic) Index of Future Expectations and a lower Ag Economy Barometer index. Sentiment with respect to short-term farmland prices was also clearly related to a farm’s expected financial performance as respondents who expect farmland prices to increase in the next 12 months also had higher financial performance indices. Not surprisingly, short-term farmland price expectations were also related to long-term farmland price expectations. Farms that expect farmland prices to increase in the next 12 months, in general, also think that farmland prices will improve in the next 5 years. Finally, the farmland investment index was significantly lower for respondents who expect farmland prices to decline in the next 12 months. In other words, this group was not as likely to indicate that farmland was a good investment.
Producer sentiment, financial performance, short-term farmland price, and land investment indices by long-term farmland price category are reported in table 2. The first category was derived from respondents who expect farmland prices to decline in the next 5 years, while the second and third categories were calculated using responses from those who expect farmland values to remain the same or increase, respectively, during the next 5 years. In general, the results in table 2 suggest that it is more difficult to explain differences in long-term farmland price expectations than it is short-term farmland price expectations. That being said, it’s clear that short-term farmland price expectations are related to long-term farmland price expectations. Also, the farmland investment index for respondents who expect farmland prices to increase in the next 5 years was significantly higher than for the other respondents. This result is very intuitive. Farm operators who expect farmland prices to remain strong are more likely to indicate that farmland is a good investment.
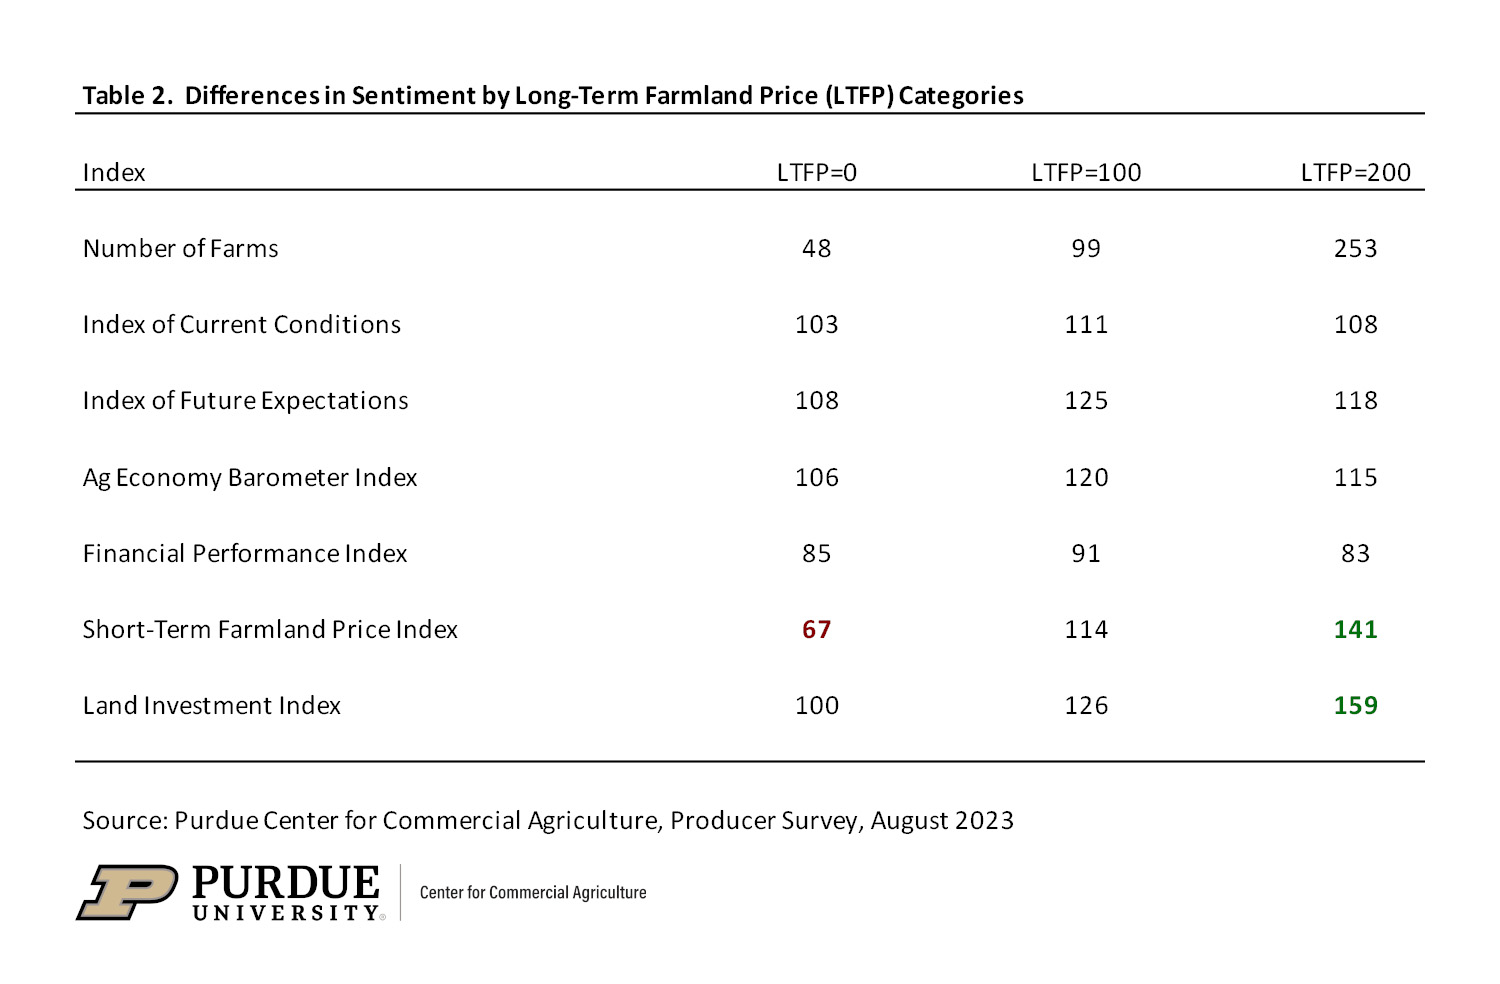
Table 2. Differences in Sentiment by Long-Term Farmland Price (LTFP) Categories
Final Comments
Farmland is by far and away the largest asset on most farm balance sheets. At the U.S. level, farmland accounts for over 80% of all total farm assets. Given the importance of farmland prices to the financial health of farms, it is useful to explore factors that impact farmland price expectations. This article examined the relationship between producer sentiment, farmland value expectations, and farm financial performance. Producer sentiment and farm financial performance expectations were related to short-term farmland price expectations, but not long-term expectations. Respondents who expect farmland prices to increase in the next 5 years tend to think that farmland is a good investment.
References
Langemeier, M. and J. Mintert. “Producer Sentiment and Farm Growth.” Center for Commercial Agriculture, Department of Agricultural Economics, Purdue University, May 4, 2023.
Mintert, J. and M. Langemeier. “Farmer Sentiment Dips Amid Weaker View of Current Conditions.” Ag Economy Barometer, September 5, 2023 (b).
![]()
![]()
![]()
![]()
![]()
TAGS:
TEAM LINKS:


RELATED RESOURCES
UPCOMING EVENTS
We are taking a short break, but please plan to join us at one of our future programs that is a little farther in the future.