August 26, 2020
Sources and Uses of Funds Statement
by Michael Langemeier
![]()
![]()
![]()
![]()
![]()
This article is one of a series of financial management articles that examine financial statements and financial analysis. In this article, a sources and uses of funds statement will be illustrated and described. A sources and uses of funds statement, often referred to as a flow of funds report, provides a mechanism for reporting how a farm’s performance during an accounting period influenced and was influenced by major funding activities. This report also reconciles information in the income statement, the balance sheet, and the cash flow statement.
Sources of funds include cash farm receipts, capital asset sales, increases in liabilities, outside equity capital infused into the business, and net non-farm cash income. The increase in total liabilities is derived from the beginning and ending balance sheets. It is particularly important to track the change in total liabilities from the beginning to the end of the year. If a farm borrows more money than its reduction in short-term and long-term debt (i.e., principal payments), we have a source of funds. Conversely, if a farm pays back more debt than it borrows, we have a use of funds.
Uses of funds include farm cash operating expenses, capital asset purchases, decreases in total liabilities, equity capital withdrawals, family living withdrawals, and income and self-employment taxes. A farm that is expanding will typically have a larger amount of capital purchases than capital sales so capital assets are generally a use of funds rather than a source of funds. A farm that is expanding would probably also have an increase in total liabilities rather than a decrease in total liabilities. In contrast, a farm that is downsizing, perhaps in anticipation of future retirement, would typically have relatively higher asset sales compared to asset purchases, and may exhibit a decrease in total liabilities as loans are paid back.
The five primary categories of a sources and uses of funds statement are beginning cash balances, cash flows from operating activities, cash flows from investing activities, cash flows from financing activities, and ending cash balances. If all cash is accounted for unlocated funds will be zero. If unlocated funds are not zero (either positive or negative), all cash is not accounted for. This is often the case if family living withdrawals, and income and self-employment taxes are not included in the statement.
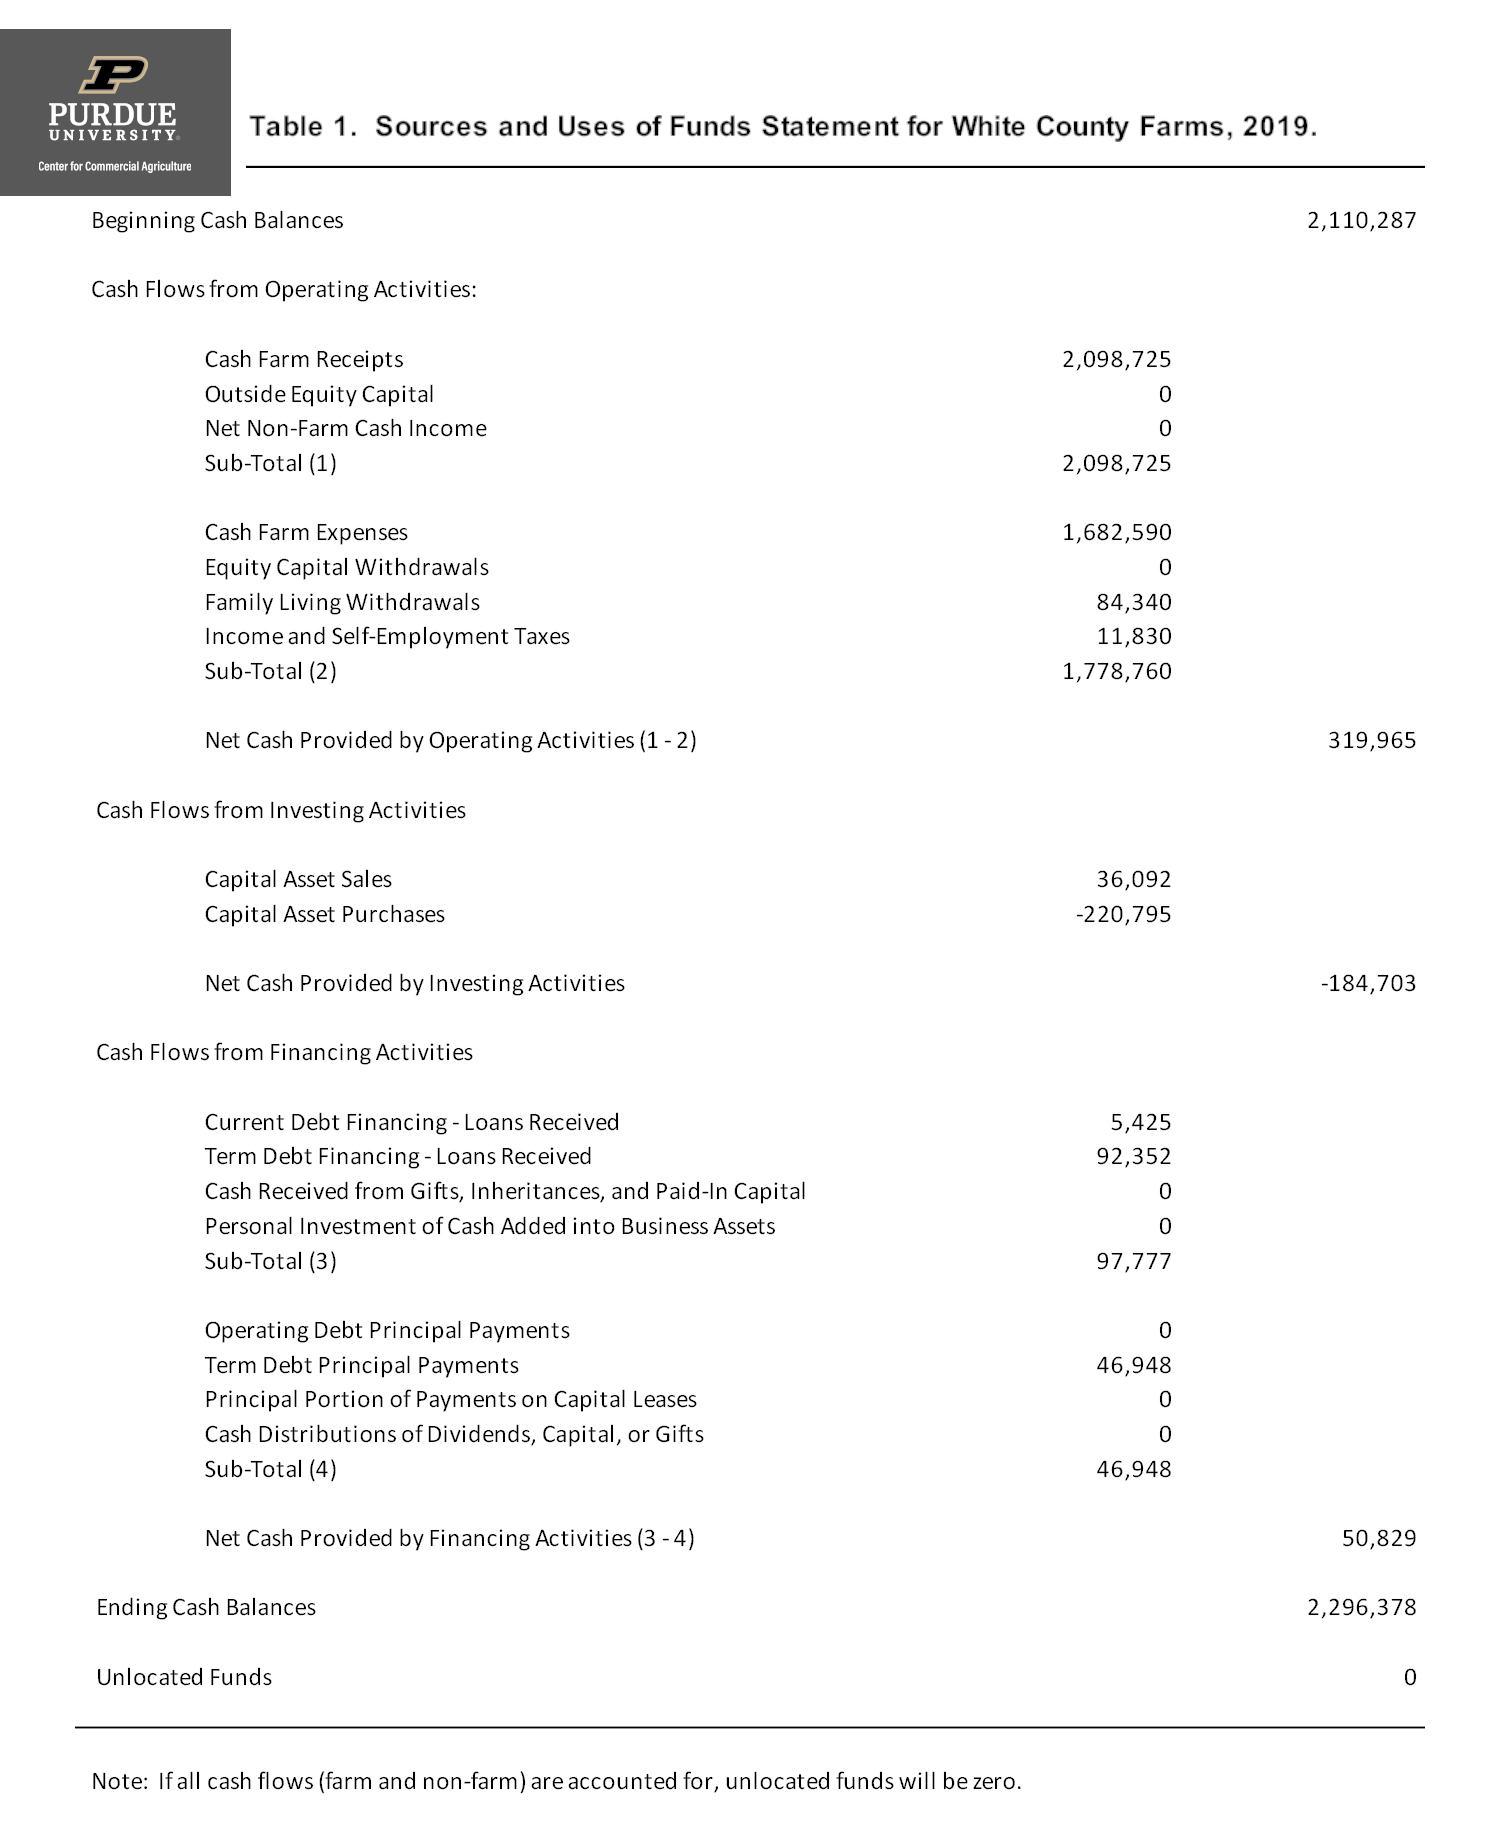
Table 1. Sources and Uses of Funds Statement for White County Farms, 2019.
Table 1 presents a sources and uses of funds statement for a case farm in west central Indiana for 2019. The net cash provided by operating activities; which subtracts cash farm expenses, family living withdrawals, and taxes from cash farm receipts; was $319,965. Net asset purchases for this farm were $184,703 (capital asset purchases minus capital asset sales) so the net cash provided by investing activities was -$184,703. On most farms, the net cash provided by investing activities will be negative, and thus will need to be covered by cash from operating activities or financing activities, or by drawing down cash balances. The net cash provided by financing activities was $50,829, which is indicative of a situation where a farm increases total liabilities (loan receipts are larger than loan payments) to help pay for capital asset purchases. For this case farm, loan receipts were $97,777 and principal payments were $46,948. The net cash provided by operating and financing activities was larger than the net cash provided by investing activities for this farm resulting in an increase in the ending cash balance.
Unlocated funds are zero in table 1 indicating that all cash is accounted for. If this balance is not zero, it is important to check the accuracy of the balance sheet, the income statement, and the cash flow statement. It is particular important to check the accuracy of capital flows in and out of the business and family living withdrawals.
This newsletter article illustrated and described a sources and uses of fund statement. Other articles in this series discuss the balance sheet, the income statement, the statement of owner’s equity, and benchmarking.
![]()
![]()
![]()
![]()
![]()
TEAM LINKS:

PART OF A SERIES:

RELATED RESOURCES
UPCOMING EVENTS
We are taking a short break, but please plan to join us at one of our future programs that is a little farther in the future.