September 29, 2020
Benchmarking Repayment Capacity Measures
by Michael Langemeier
![]()
![]()
![]()
![]()
![]()
This article is one of a series of financial management articles that examine financial statements and financial analysis. In this article, repayment capacity measures are illustrated for a case farm and discussed.
Table 1 contains the definitions of the pertinent repayment capacity measures. This table also contains values for a case farm in west central Indiana using 2019 data. The case farm values were obtained from the balance sheet, the income statement, and the sources and uses of funds statement, all of which are illustrated in other articles in this series. Repayment capacity measures include capital debt repayment capacity, capital debt repayment margin, replacement margin, term-debt coverage ratio, and replacement margin coverage ratio.
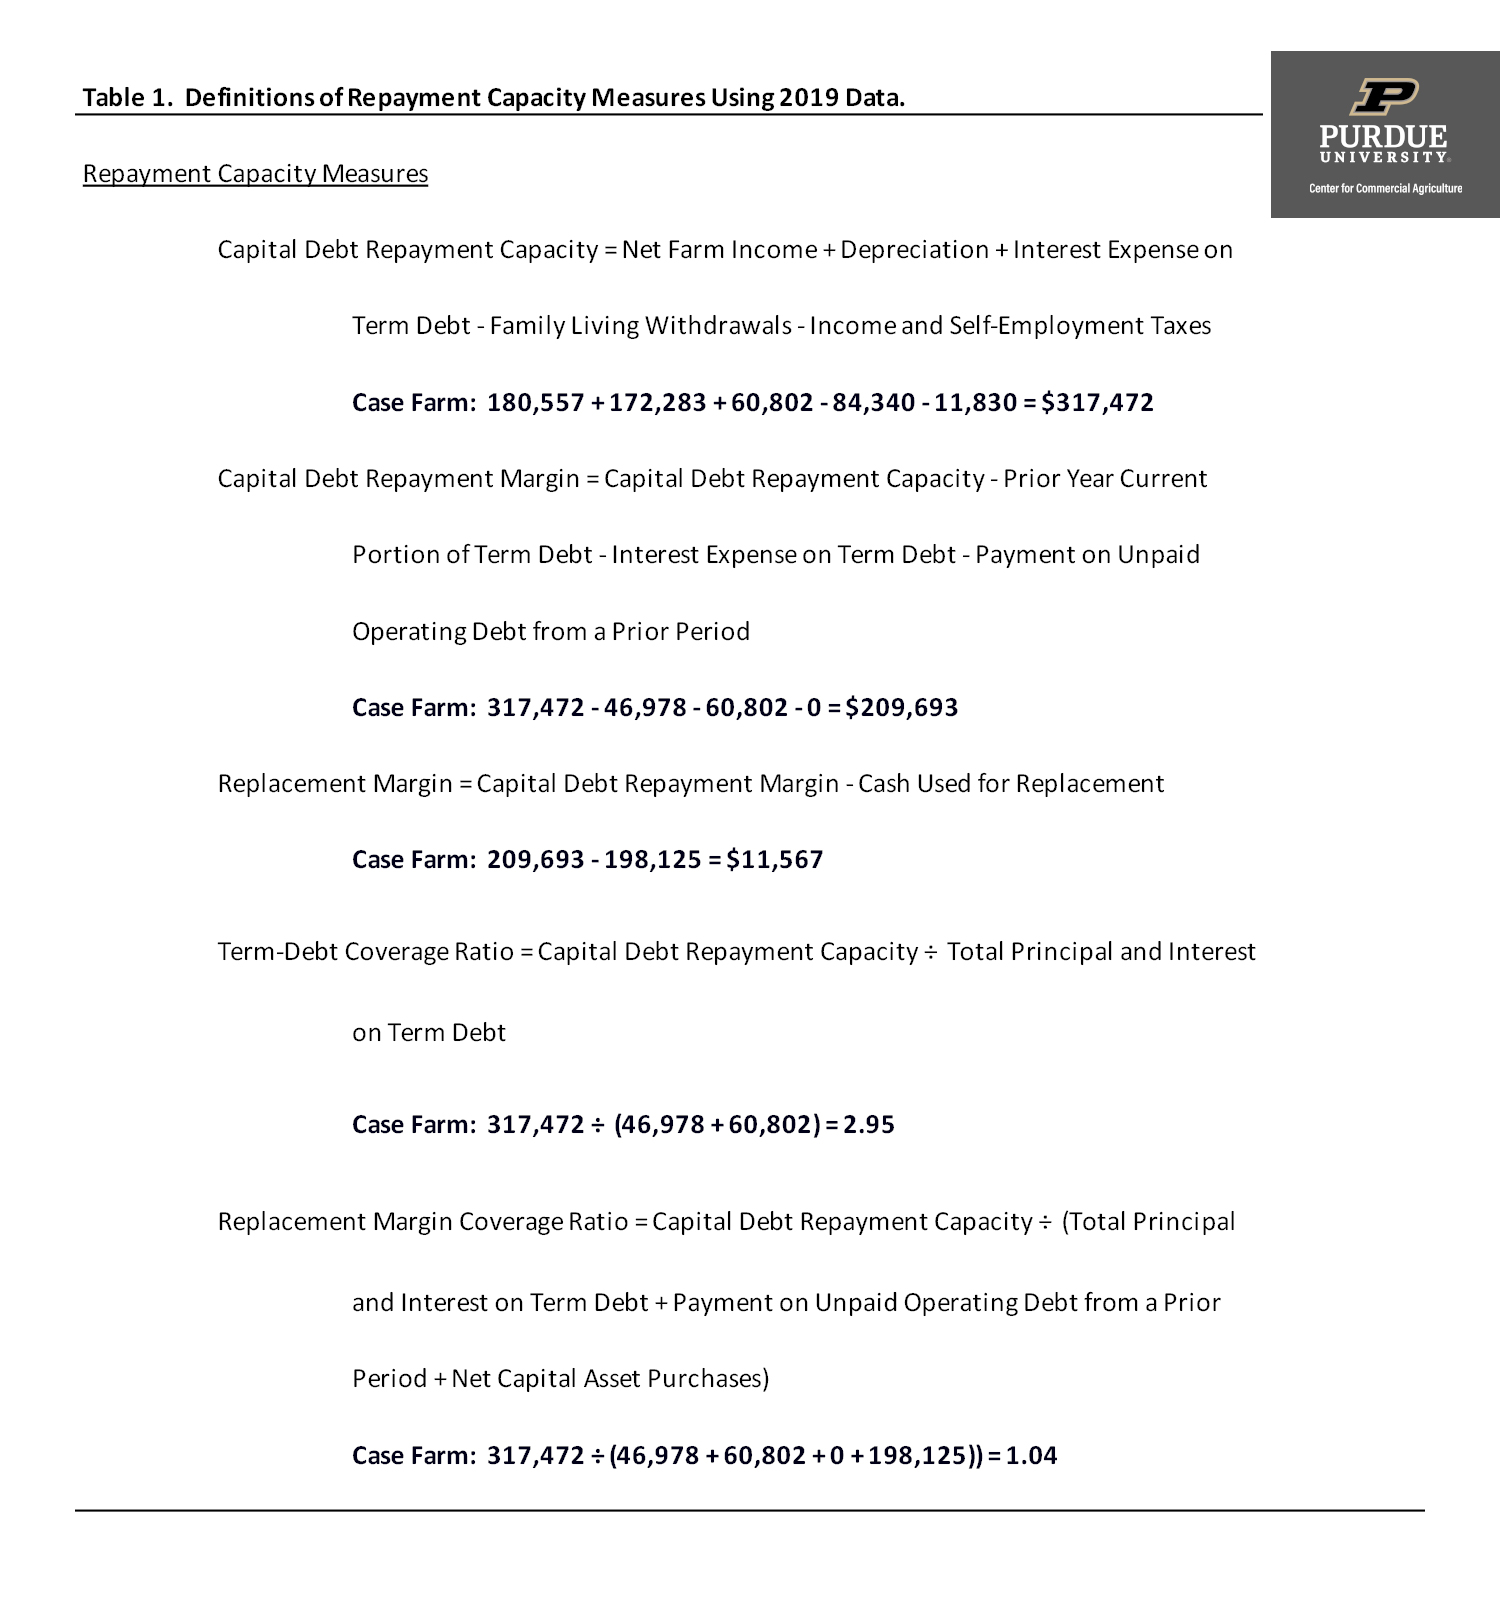
Table 1. Definitions of Repayment Capacity Measures Using 2019 Data.
Capital debt replacement capacity, capital debt replacement margin, and replacement margin measure a farm’s ability to repay debt and replace assets. These three ratios are calculated sequentially. The replacement margin will be positive if the farm can cover all debt payments and replace assets. For this ratio to be positive, capital debt repayment capacity (net farm income plus depreciation plus interest on term debt minus family living withdrawals minus income and self-employment taxes) must be greater than principal and interest payments, and net asset purchases (asset purchases minus asset sales).
The term-debt coverage ratio provides a measure of the farm’s ability to cover all term debt. The greater the ratio is over 1, the greater the margin to cover term debt obligations. The replacement margin coverage ratio measures a farm’s ability to cover term debt and asset purchases. The greater the ratio is over 1, the greater the margin to cover term debt and asset purchases.
Table 2 summarizes the case farm values for the repayment capacity measures. Stoplight terminology can be used to evaluate repayment capacity measures. A negative replacement margin, a term-debt coverage ratio below 1, or a replacement margin coverage ratio below 1 would be in the “red” region. The measures for the case farm are in the “green” region. The repayment capacity measures illustrated in table 2 suggest that the case farm has sufficient funds to cover debt obligations and asset purchases. In particular, it is important to note that the replacement margin is positive and that the replacement margin coverage ratio is greater than one.
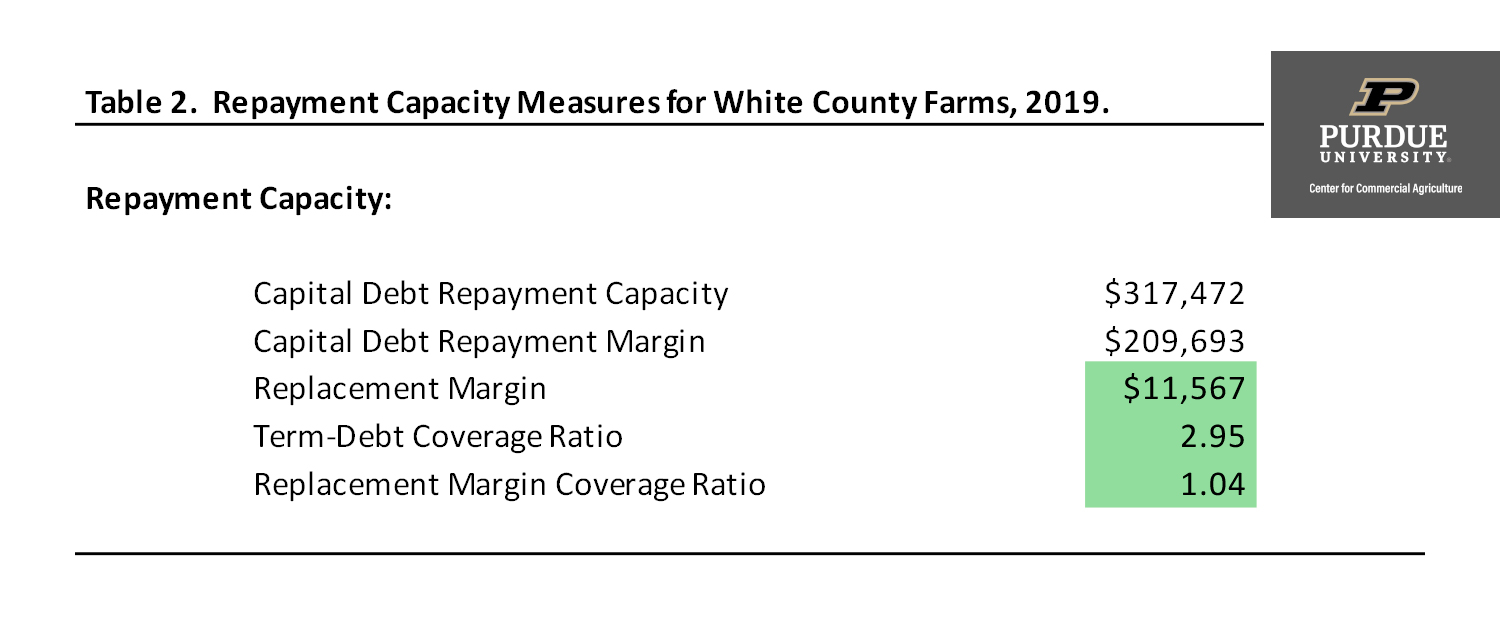
Table 2. Repayment Capacity Measures for White County Farms, 2019.
Though not shown in this article, it is also very important to determine whether the replacement margin is positive in the long-run (e.g., latest ten-year period). If it is not, the farm has had difficulty replacing depreciable assets in a timely fashion. Under this scenario, it is also likely that the farm will having trouble expanding the business, including bringing another family member into the business. The average replacement margin for the case farm for the latest ten-year period (2010 to 2019) was approximately $116,000.
This article defined, described, and illustrated repayment capacity measures for a case farm. The case farm had sufficient funds to cover debt obligations and asset purchases. Other articles in the financial management series discuss profitability and financial efficiency benchmarks, crop machinery benchmarks, and labor benchmarks.
References
Langemeier, M. “Market Value Balance Sheet and Analysis.” Center for Commercial Agriculture, Purdue University, August 26, 2020.
Langemeier, M. “Components of an Accrual Farm Income Statement.” Center for Commercial Agriculture, Purdue University, August 26, 2020.
Langemeier, M. “Sources and Uses of Funds Statement.” Center for Commercial Agriculture, Purdue University, August 26, 2020.
![]()
![]()
![]()
![]()
![]()
TEAM LINKS:

PART OF A SERIES:

RELATED RESOURCES
Producers continued to express concern about farm finances as the June Purdue University/CME Group Ag Economy Barometer recorded a 6-point decline in farmer sentiment to 113.
READ MOREUPCOMING EVENTS
We are taking a short break, but please plan to join us at one of our future programs that is a little farther in the future.