January 6, 2014
Price Loss Coverage (PLC) Program
![]()
![]()
![]()
![]()
![]()
Overview
Price Loss Coverage (PLC) is a new program in the 2014 Farm Bill. PLC payments are made when the national marketing year average (MYA) price falls below a legislated reference price for the commodity. The PLC payment for a given commodity is the difference between the commodity’s reference price and the national MYA price multiplied by the PLC program yield and paid on 85% of a farm’s base acres allocated to the commodity. Crops enrolled in PLC have the additional option of purchasing program insurance through the Supplemental Coverage Option (SCO), a program that extends insurance coverage into the contract’s deductible with premiums for SCO subsidized at 65%. The SCO add-on program is designed to provide PLC enrollees some insurance protection against year to year shallow losses that fall within the normal insurance deductible.
Notes
- Program choice in the 2014 Farm Bill is referred to as program election. Election is done on a crop by crop basis for the PLC and ARC-CO programs (see ARC-CO fact sheet). Only the ARC-IC re- quires all base acres on a farm be enrolled in the ARC-IC program.
- Election decisions must be made by March 31, 2015. Once a commodity is elected to be covered by a program, the commodity will be covered by that pro- gram for the 5 year life of the farm bill which spans the 2014 to 2018 crops. Even though the election is for the 5 years, farmers must still “enroll” their base acres each year at their FSA office.
Definitions
- PLC: The acronym for the Price Loss Coverage program, a new payment program in the 2014 farm bill.
- MYA Price: The national Marketing Year Average price as calculated by USDA. The U.S. average cash price received for a crop over the entire marketing year.
- Reference Price: The statutory (given in the law) target price for each covered commodity.
- Payments are made when current revenue falls below this target.
- Payment increases as the national marketing year average price falls further below the reference price.
- Base Acres: The land are of an FSA farm number that is eligible to receive payments. Each base acre is allocated to a specific commodity.
- That allocation determines which commodity’s revenue triggers payments for that base acre.
- The allocation of a base acres to a particular commodity has no bearing on what crop may be planted on that base acre.
- A farm receives payments on only 85% of its base acreage, with each acre reduced by 15% of the calculated per acre payment.
- PLC: The historic yield for a commodity grown on a farm and used as the basis for calculating the per acre payment in PLC.
- SCO: The acronym for Supplemental Coverage Option program, an insurance contract extended only to base acres enrolled in the PLC program.
Calculating a PLC Payment
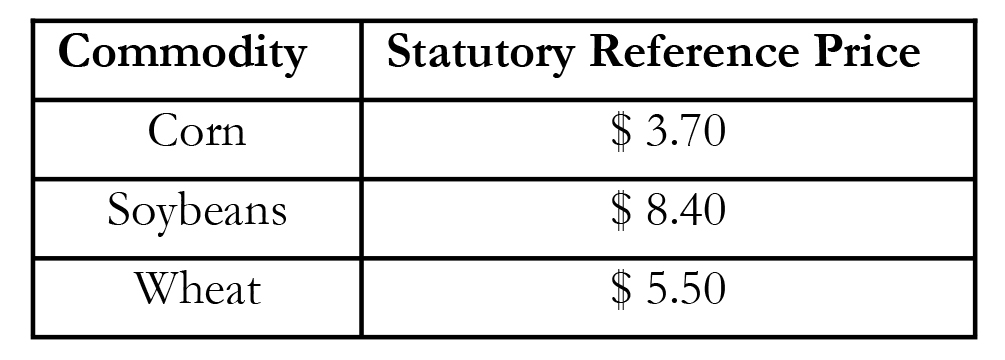 This table gives statutory reference prices for main Indiana crops. At the end of the marketing year for the 2014 crop, USDA will report the national marketing year average price. Any MYA price below the reference price for a commodity will trigger payments for base acres allocated to the commodity according to the PLC payment formula.
Payment Example
PLC Payment = [Reference Price –MYA Price] x PLC Yield x Crop Base Acres x 0.85
Given the following information as an example for corn:
National Price = $3.50
PLC Corn Yield= 140 bushels per acre
Corn Base Acres= 100
PLC Payment = [$3.70 -$3.50] x 140 x 100 x 0.85 = $2,380
PLC Payment = $23.80 per corn base acre
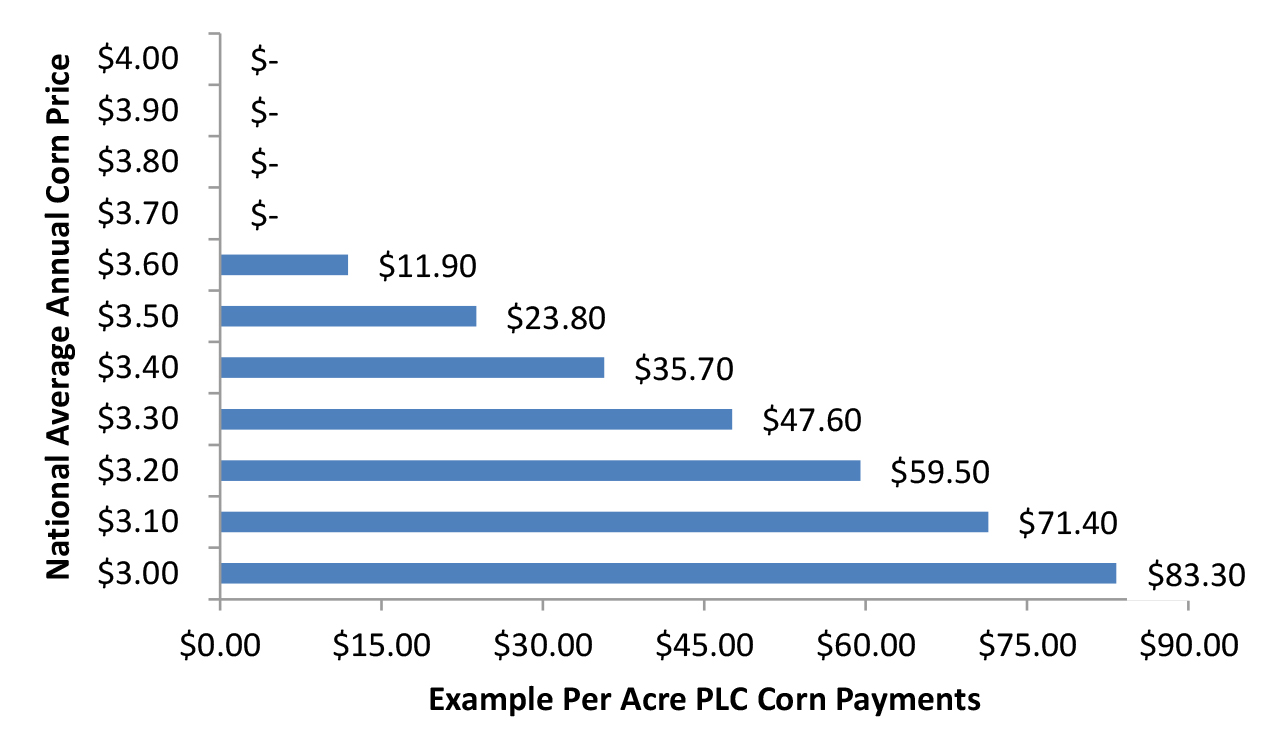 This graph shows how per acre corn PLC payments will change with different national mar-keting year average prices using the calculation ex-ample of 100 base acres of corn with a PLC yield of 140 bushels per acre. The program is counter-cyclical in that payments increase as the market price drops. PLC payments are limited only by the total limit on commodity payments to farmers ($125,000 per year) and the change that occurs to price support when the loan rate price is reached.
Additional information on 2014 Farm Bill programs can be found here.
Disclaimer: This document is provided for education purposes. The information in this fact sheet is intended to assist farm operators and land owners as they form their own decisions based on the specifics of their operations as well as their own management objectives and risk attitudes.
![]()
![]()
![]()
![]()
![]()
TAGS:
TEAM LINKS:
RELATED RESOURCES
UPCOMING EVENTS
We are taking a short break, but please plan to join us at one of our future programs that is a little farther in the future.