Archived Custom Rates
Historical Indiana Farm Custom Rates can be accessed in our archive. These are updated every-other year and date back to 2017.
June 8, 2019
2019 Indiana Farm Custom Rates
by Michael Langemeier
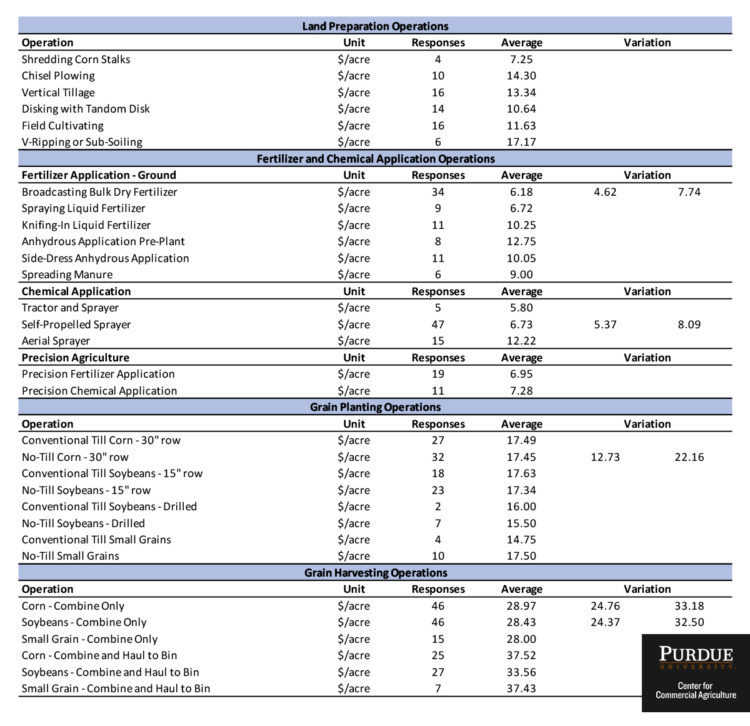
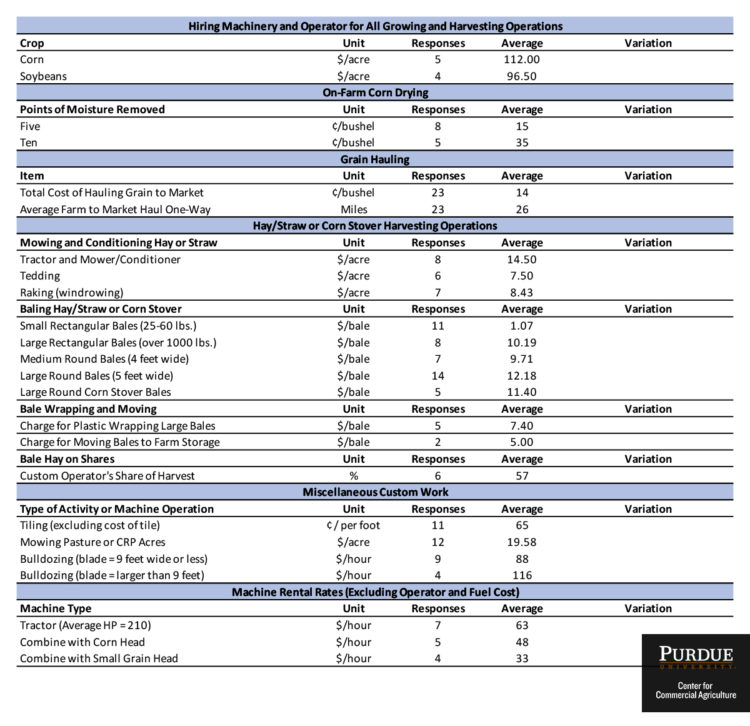
The rates reported in this publication were compiled from questionnaires received from farmers, farm owners, farm custom operators, and professional farm managers in Indiana. Purdue Extension educators and specialists developed the questionnaire. Purdue Educators distributed the questionnaires at meetings and events statewide during the last month of 2018 and the first three months of 2019. Respondents were asked to report custom rates they had either paid or received during the past year. We are grateful to the 101 survey respondents who provided information for this publication.
Unless otherwise stated, the rates reported include payments made for fuel, operator labor, and machinery ownership costs. For each operation, the average of the responses received is reported. The variation of rates around the average is reported when the number of respondents for a question was at least 30. The variation is the average rate plus and minus one standard deviation. Approximately two-thirds of the responses would be expected to fall between the high and low numbers used to summarize the extent of the variation. Larger standard deviations in relation to reported averages indicate greater variability in the reported custom rates. For several of the operations the custom rates reported varied widely. In general, operations for which fewer than five responses were received are not reported here. A small number of responses signals report users to be extra cautious when using the survey results.
Farm custom rates may differ significantly from one area in the state to another based on availability of custom operators and demand for their services. Therefore, the statewide averages reported here might be quite different from the going rate in any given area. Custom rates in a given area may vary significantly according to timeliness, operator skill, field size and shape, crop conditions, the performance characteristics of the machine being used, the relationship between the custom operator and the person needing custom work done, competitive pressures, and economic circumstances of the custom operator. The variation of reported rates was large for many of the operations and thus should only be used as a starting point for establishing a rate in any given situation.
In Indiana, custom work is often done by farming neighbors after they complete their own work. In these situations, the custom operator may charge a custom rate that is well below the full cost of owning and operating their farm machinery either to build goodwill or to more fully utilize their machinery capacity. For that reason, readers of this publication should not interpret the average rates reported here as indicative of the total cost of completing these operations. Custom operators who do large amounts of custom work should estimate the full ownership and operating costs of their services before agreeing to work for the “going rate” in their area.

TAGS:
TEAM LINKS:
RELATED RESOURCES
Margaret Lippsmeyer presented during agri benchmark’s 2024 annual conference in mid June, which was hosted by the Spanish Ministry of Agriculture in Valladolid, Spain. An increase in soybean acreage may come from either (a) shifting away from continuous corn rotations to corn-soy and (b) shifting corn-soy rotations toward corn-soy-soy. Based on agri benchmark data, Margaret showed that option (a) would require an increase in soybean prices of 6% and option (b) of 8% to make these rotations preferable over existing ones.
READ MOREUPCOMING EVENTS
We are taking a short break, but please plan to join us at one of our future programs that is a little farther in the future.


