


September 2, 2020
Conventional and Organic Enterprise Net Returns
by Michael Langemeier and Michael O’Donnell
![]()
![]()
![]()
![]()
![]()
Due to continued increases in demand for certified organic grains, crop farmers that have transitioned from conventional to certified organic grains report higher net returns per acre (McBride et al., 2015; Greene et al., 2017; Greene and Vilorio, 2018; Center for Farm Financial Management, 2020). Despite this, certified organic land accounts for less than 2 percent of U.S. farmland (U.S. Agricultural Census, 2017). Information pertaining to the relative profitability of conventional and organic production is often lacking.
Two previous articles (here and here) compared net returns for conventional and organic crop rotations. The organic crop rotations were found to be relatively more profitable than a conventional corn/soybean crop rotation and a conventional corn/soybean/wheat crop rotation. These two articles used FINBIN data (Center for Farm Financial Management, 2020) from 2014 to 2018 to help estimate the difference between conventional and organic crop prices and yields. This article uses FINBIN data from 2015 to 2019, to compare crop yields, gross revenue, total expense, and net returns for conventional and organic alfalfa, corn, oats, soybeans, and winter wheat. The organic enterprise data represents farms that have already transitioned to organic production, and thus do not include information pertaining to the transition phase.
Crop Yields
Table 1 shows the average conventional and organic crop yields for alfalfa, corn, oats, soybeans, and winter wheat. The ratio illustrated in the last column of the table was computed by dividing the organic crop yield by the conventional crop yield. Alfalfa and oats exhibited the smallest differences in crop yields between conventional and organic crops. The yield drags for corn, soybeans, and winter wheat ranged from 29 to 32 percent.
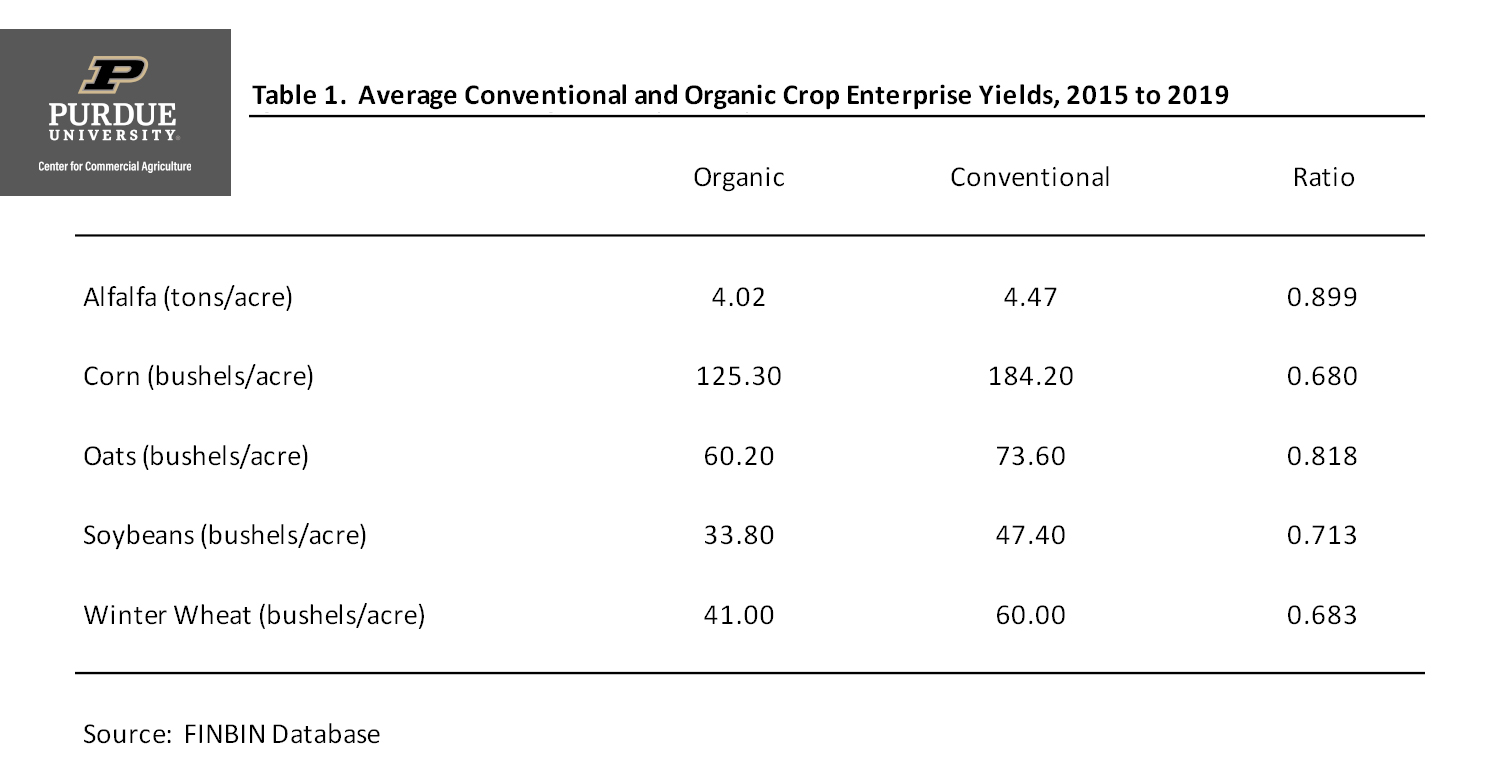
Table 1. Average Conventional and Organic Crop Enterprise Yields, 2015 to 2019
Gross Revenue, Total Expense, and Net Return to Land
Gross revenue, total expense, and net return to land per unit for alfalfa, corn, oats, soybeans, and winter wheat are presented in table 2. Gross revenue includes crop revenue, crop insurance indemnity payments, government payments, and miscellaneous income. Total expenses include all cash and opportunity costs, other than those associated with owned farmland. Farmland costs included in the total expense reported in table 2 were comprised of cash rent, real estate taxes, and interest, which would be lower than the full opportunity cost on owned land. Just to give the reader some idea as to how large this excluded cost may be, you would need to add an estimated $0.15 per bushel ($0.50 per bushel) to the total expense for conventional corn (conventional soybeans) if you wanted to account for the full opportunity cost on owned land. Also, note that the per unit net returns presented in table 2 represent a net return to land rather than an economic profit.
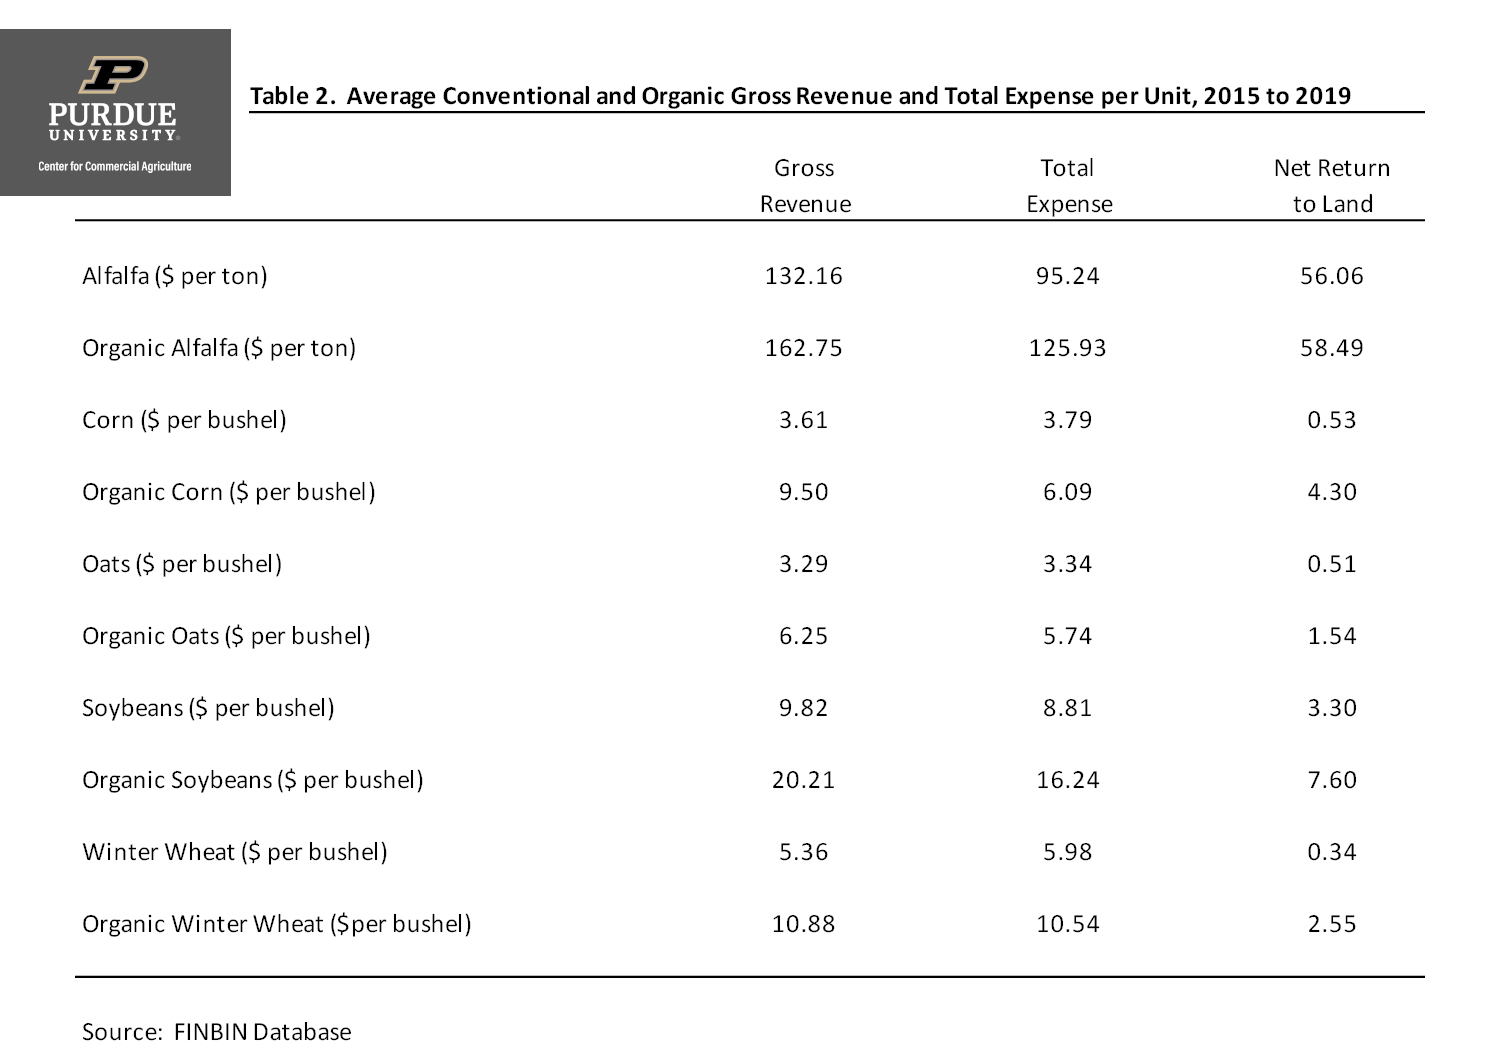
Table 2. Average Conventional and Organic Gross Revenue and Total Expense per Unit, 2015 to 2019
Though conventional and organic crops face different market phenomena, it is common to compare conventional and organic crop prices. Comparing organic to conventional gross return per unit reported in table 2, the smallest ratio of organic to conventional gross return was for alfalfa (1.23) and the largest ratio (2.63) was for corn. Organic oat, soybean, and winter wheat prices were approximately double their conventional counterparts.
Examining gross revenue and total expense per unit for each enterprise reported in table 2, it is evident that economic losses occurred for corn, oats, and winter wheat grown conventionally. In contrast, for all of the organic crops, the total expense per unit was below the gross revenue per unit. The smallest difference between gross revenue and total expense per unit for the organic crops occurred for oats and winter wheat. Market opportunities for organic small grains vary substantially by region, and it can be difficult to find markets for these crops. Numerous organic crop rotations include a small grain in the rotation, so the relatively small difference between gross revenue and total expense for these crops is important when computing net returns for organic crop rotations. It is also useful to examine differences in net returns per unit for each crop (e.g., corn versus organic corn). The largest differences in net return per unit occurred for corn and organic corn, and for soybeans and organic soybeans. The difference in net returns between the two crop rotation systems was very small for alfalfa.
Net return to land comparisons can also be made on a per acre basis. The average difference in net returns to land between organic and conventional crops (e.g., corn versus organic corn) was $133 per acre. The largest difference was $441 per acre for corn. The difference for soybeans was $101 per acre, and differences for oats and winter wheat were $55 and $84 per acre, respectively. Interestingly, the net return per acre for conventional alfalfa was $15 per acre higher than the net return per acre for organic alfalfa.
Difference in Net Returns Among Farms
The results above focus on differences in average net returns to land. Economists have long pointed out the large differences in financial performance among farms. To account for the differences among farms, we used the FINBIN database to examine net returns for conventional and organic corn and soybean enterprises.
Figure 1 presents the comparisons among enterprise deciles (ten equal groups) for conventional and organic corn. Net return in this figure was computed by subtracting land expenses from net return to land, but exclude government payments, operator labor, and a management charge. The median net returns per acre for conventional corn and organic corn were -$5 and $437, respectively. The difference in net return per acre for the bottom and top deciles was $446 for conventional corn and $1,188 for organic corn. Despite the larger median net return, it is important to note that there are quite a few organic farms with lower net returns for corn than their conventional counterparts.
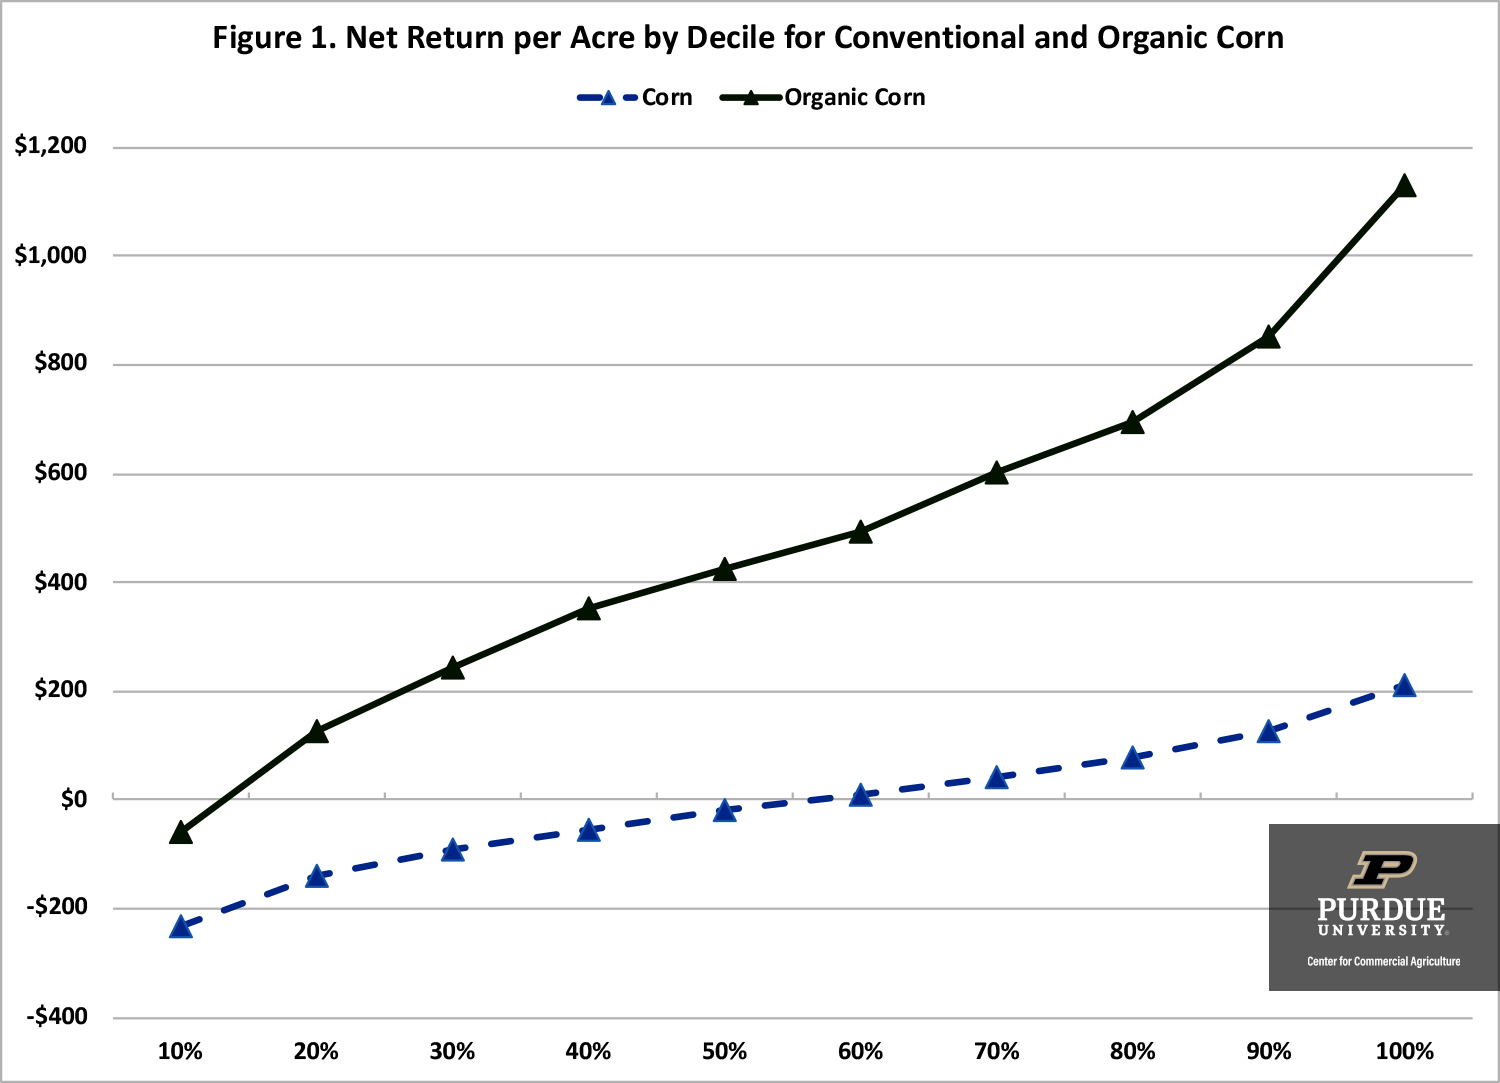
Figure 1. Net Return per Acre by Decile for Conventional and Organic Corn
Comparisons among enterprise deciles for conventional and organic soybeans are presented in figure 2. The median net returns for conventional soybeans and organic soybeans were $68 and $228, respectively. The difference in net return per acre for the bottom and top deciles was $377 for conventional soybeans and was $919 organic soybeans. Even though the median net return for organic soybeans is higher than the median net return for conventional soybeans, the organic producers in the lowest two deciles have lower net returns than the conventional soybean producers in the lowest two deciles.
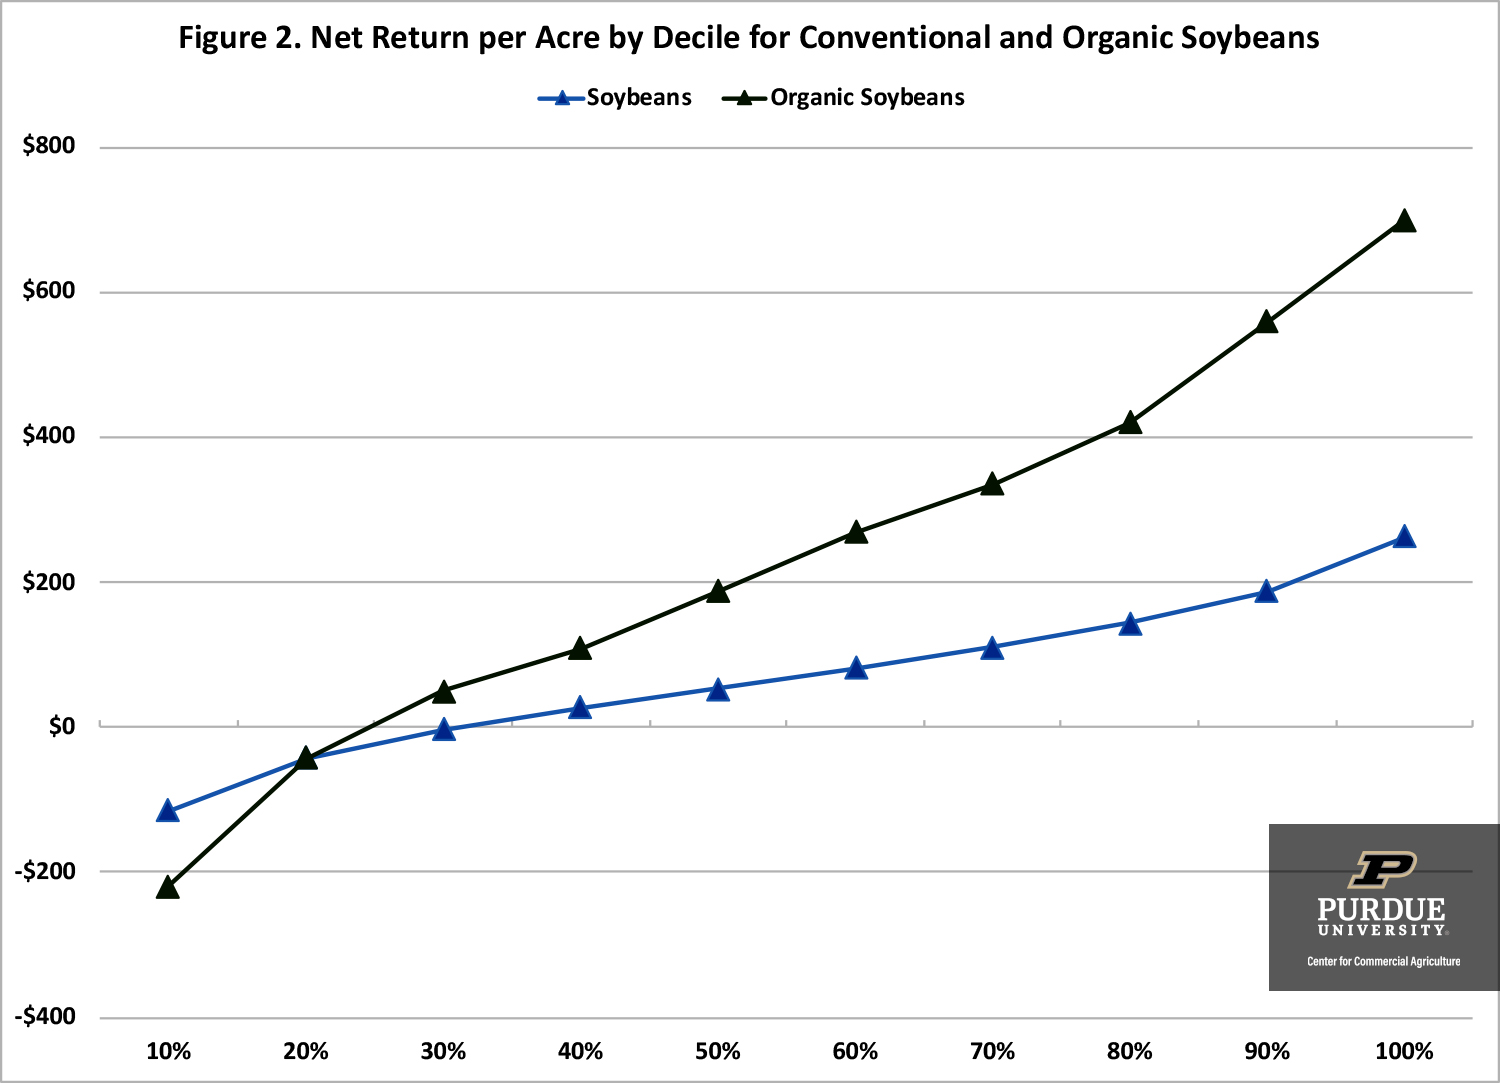
Figure 2. Net Return per Acre by Decile for Conventional and Organic Soybeans
What can we make of the results in figures 1 and 2? First, there is a larger difference in net returns between the organic producers than there is between the conventional producers. This result could be due to learning effects or the more complicated rotations associated with organic crop production. Second, obtaining a boost in net returns from organic soybean production appears to be much more difficult than it is for organic corn. This could be due to weed control issues often encountered when producing organic soybeans. The results in figures 1 and 2 stress the importance of examining the sensitivity of budgeted net returns for organic crops to changes in price, yield, and cost assumptions before transitioning acres.
Summary and Conclusions
This article compared crop yields, gross revenue, total expense, and net returns for conventional and organic corn and soybeans. FINBIN data (Center for Farm Financial Management, 2020) were used to make the comparisons in this article. Consistent with previous work, the organic enterprises had lower crop yields, higher crop prices and gross returns, and higher net returns. However, there was a much wider difference in enterprise net returns among organic corn and soybean enterprises than there was among conventional corn and soybean enterprises. This wider difference is likely due to the difficulty of managing an organic crop system, and the learning curve associated with growing organic crops.
References
Center for Farm Financial Management, University of Minnesota, FINBIN web site, accessed August 13, 2020.
Greene, C., G. Ferreira, A. Carlson, B. Cooke, and C. Hitaj. “Growing Organic Demand Provides High-Value Opportunities for Many Types of Producers.” USDA-ERS, Amber Waves, February 6, 2017.
Greene, C. and D. Vilorio. “Lower Conventional Corn Prices and Strong Demand for Organic Livestock Feed Spurred Increased U.S. Organic Corn Production in 2016.” USDA-ERS, Amber Waves, June 4, 2018.
Langemeier, M. and X. Fang. “Comparison of Conventional and Organic Crop Rotations.” Center for Commercial Agriculture, Department of Agricultural Economics, Purdue University, June 2020.
Langemeier, M. and X. Fang. “Comparison of a Conventional Crop Rotation with an Organic Forage-Based Crop Rotation.” Center for Commercial Agriculture, Department of Agricultural Economics, Purdue University, June 2020.
McBride, W.D., C. Greene, L. Foreman, and M. Ali. “The Profit Potential of Certified Organic Field Crop Production.” USDA-ERS, Economic Research Report Number 188, July 2015.

![]()
![]()
![]()
![]()
![]()
TAGS:
TEAM LINKS:


RELATED RESOURCES
Margaret Lippsmeyer presented during agri benchmark’s 2024 annual conference in mid June, which was hosted by the Spanish Ministry of Agriculture in Valladolid, Spain. An increase in soybean acreage may come from either (a) shifting away from continuous corn rotations to corn-soy and (b) shifting corn-soy rotations toward corn-soy-soy. Based on agri benchmark data, Margaret showed that option (a) would require an increase in soybean prices of 6% and option (b) of 8% to make these rotations preferable over existing ones.
READ MOREUPCOMING EVENTS
We are taking a short break, but please plan to join us at one of our future programs that is a little farther in the future.