September 25, 2020
Benchmarking Profitability and Financial Efficiency
by Michael Langemeier
![]()
![]()
![]()
![]()
![]()
This article is one of a series of articles that examine financial statements and financial analysis. In this article, a case farm in west central Indiana is used to illustrate financial performance benchmarks for profitability and financial efficiency ratios.
Table 1 contains the profitability and financial efficiency ratios for the case farm for 2019 and 2010 to 2019, the latest ten-year period. Tables 2 and 3 contain definitions for each ratio, as well as the computation of each ratio for the case farm, using 2019 information. The case farm values were obtained from the balance sheet, the income statement, and the sources and uses of funds statement, all of which are illustrated in other articles in this series. Table 4 contains a financial scorecard for profitability and financial efficiency ratios. Ideally, a farm would like to be in the “green” region for each ratio illustrated in table 4. This is often not possible, which emphasizes the importance of analyzing the ratios as a group rather than focusing on one or two of the ratios.
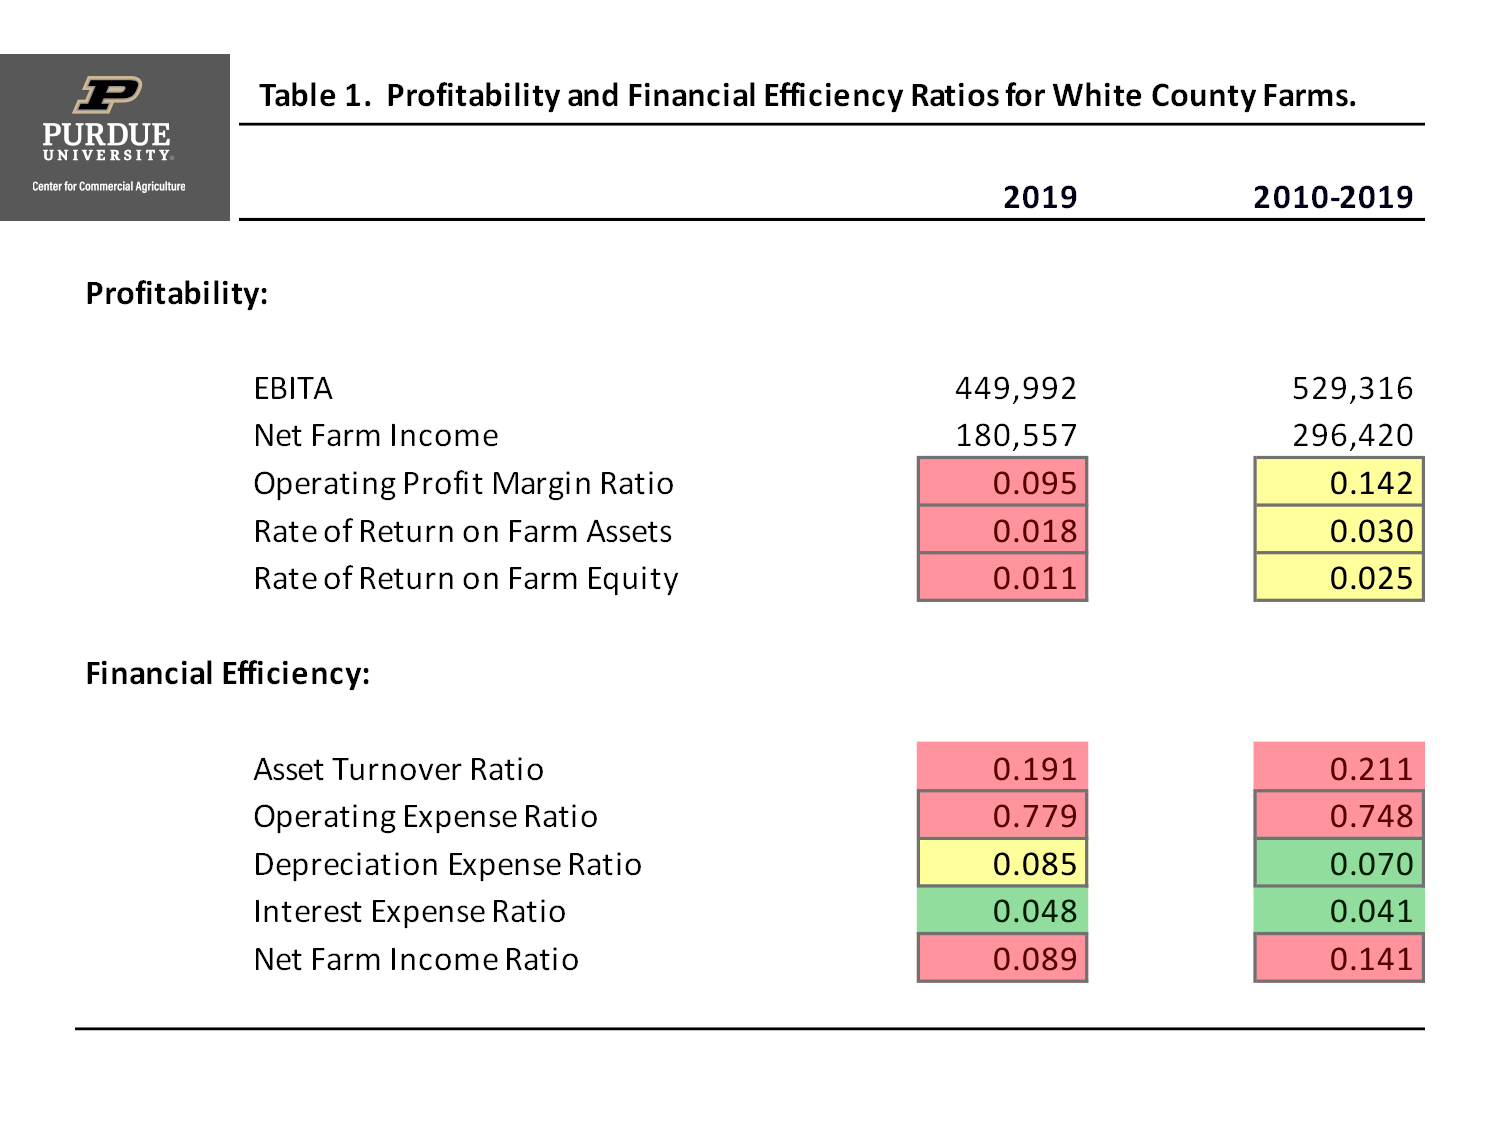
Table 1. Profitability and Financial Efficiency Ratios for White County Farms.
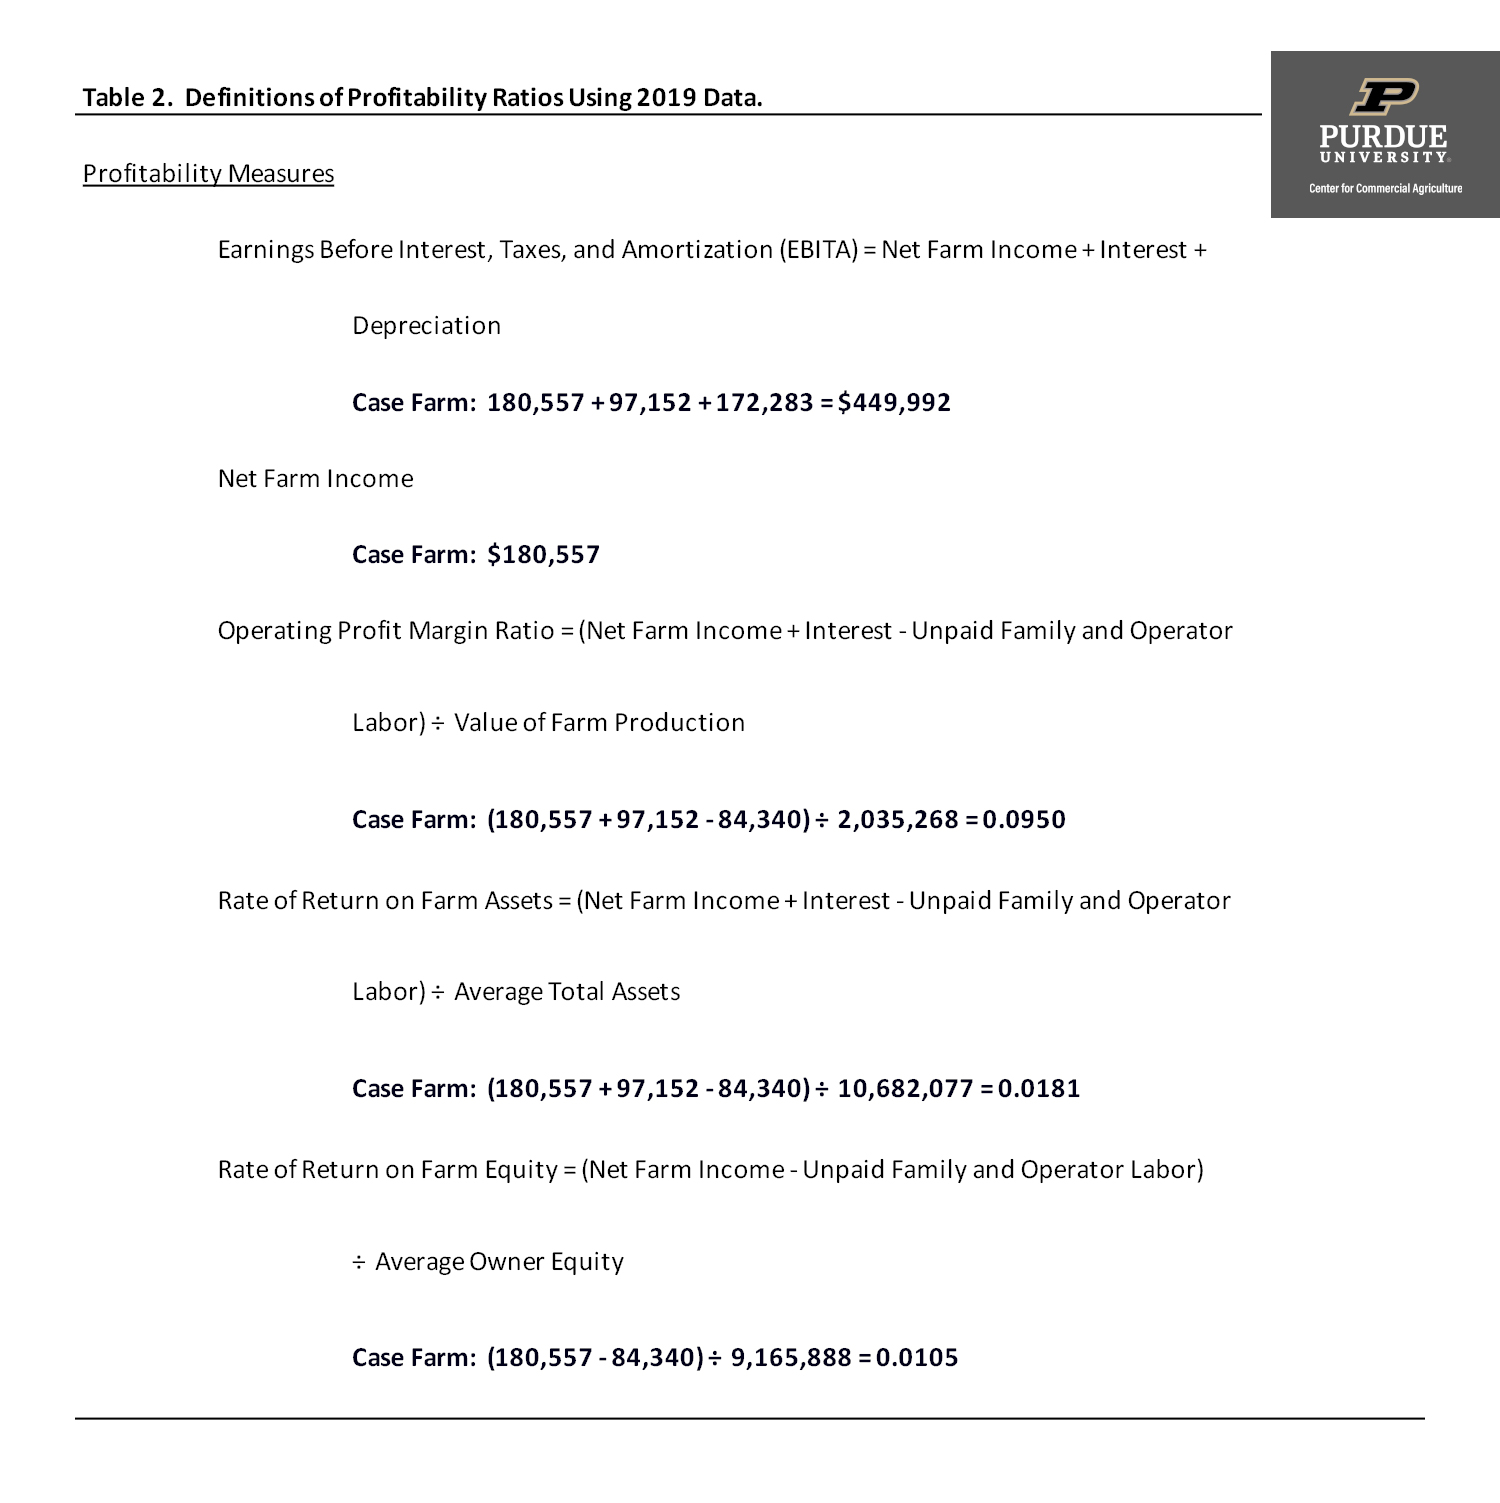
Table 2. Definitions of Profitability Ratios Using 2019 Data.
Before analyzing each ratio, let’s define some of the terms and ratios. EBITA (Earnings Before Interest, Taxes, and Amortization), as the name implies, is used to cover interest, taxes, and amortization, which includes depreciation. Net farm income is used for family living, to repay debt, and to purchase new and used assets. Though these two measures are extremely important to monitor over time on a particular farm, due to the fact that these two measures depend on a farm’s size, it seldom makes sense to compare EBITA and net farm income with other farms. Because they take into account farm size, the profitability measures other than EBITA and net farm income presented in tables 1 and 2 are more useful when making comparisons across farms. The “green” region for the operating profit margin ratio, rate of return on farm assets, and rate of return for farm equity are 20 percent, 7 percent, and 8 percent, respectively. It is important to note that the “green” region for the rate of return on farm equity is higher than the “green” region for the rate of return on farm assets. If a farm is effectively utilizing borrowed funds, the rate of return on farm equity will be higher than the rate of return on farm assets. Also, it is important to note that the rates of return exclude asset appreciation during the year (e.g., increase in land values during the year). Thus, these rates of returns reflect the earning capacity of the farm rather than investment returns.
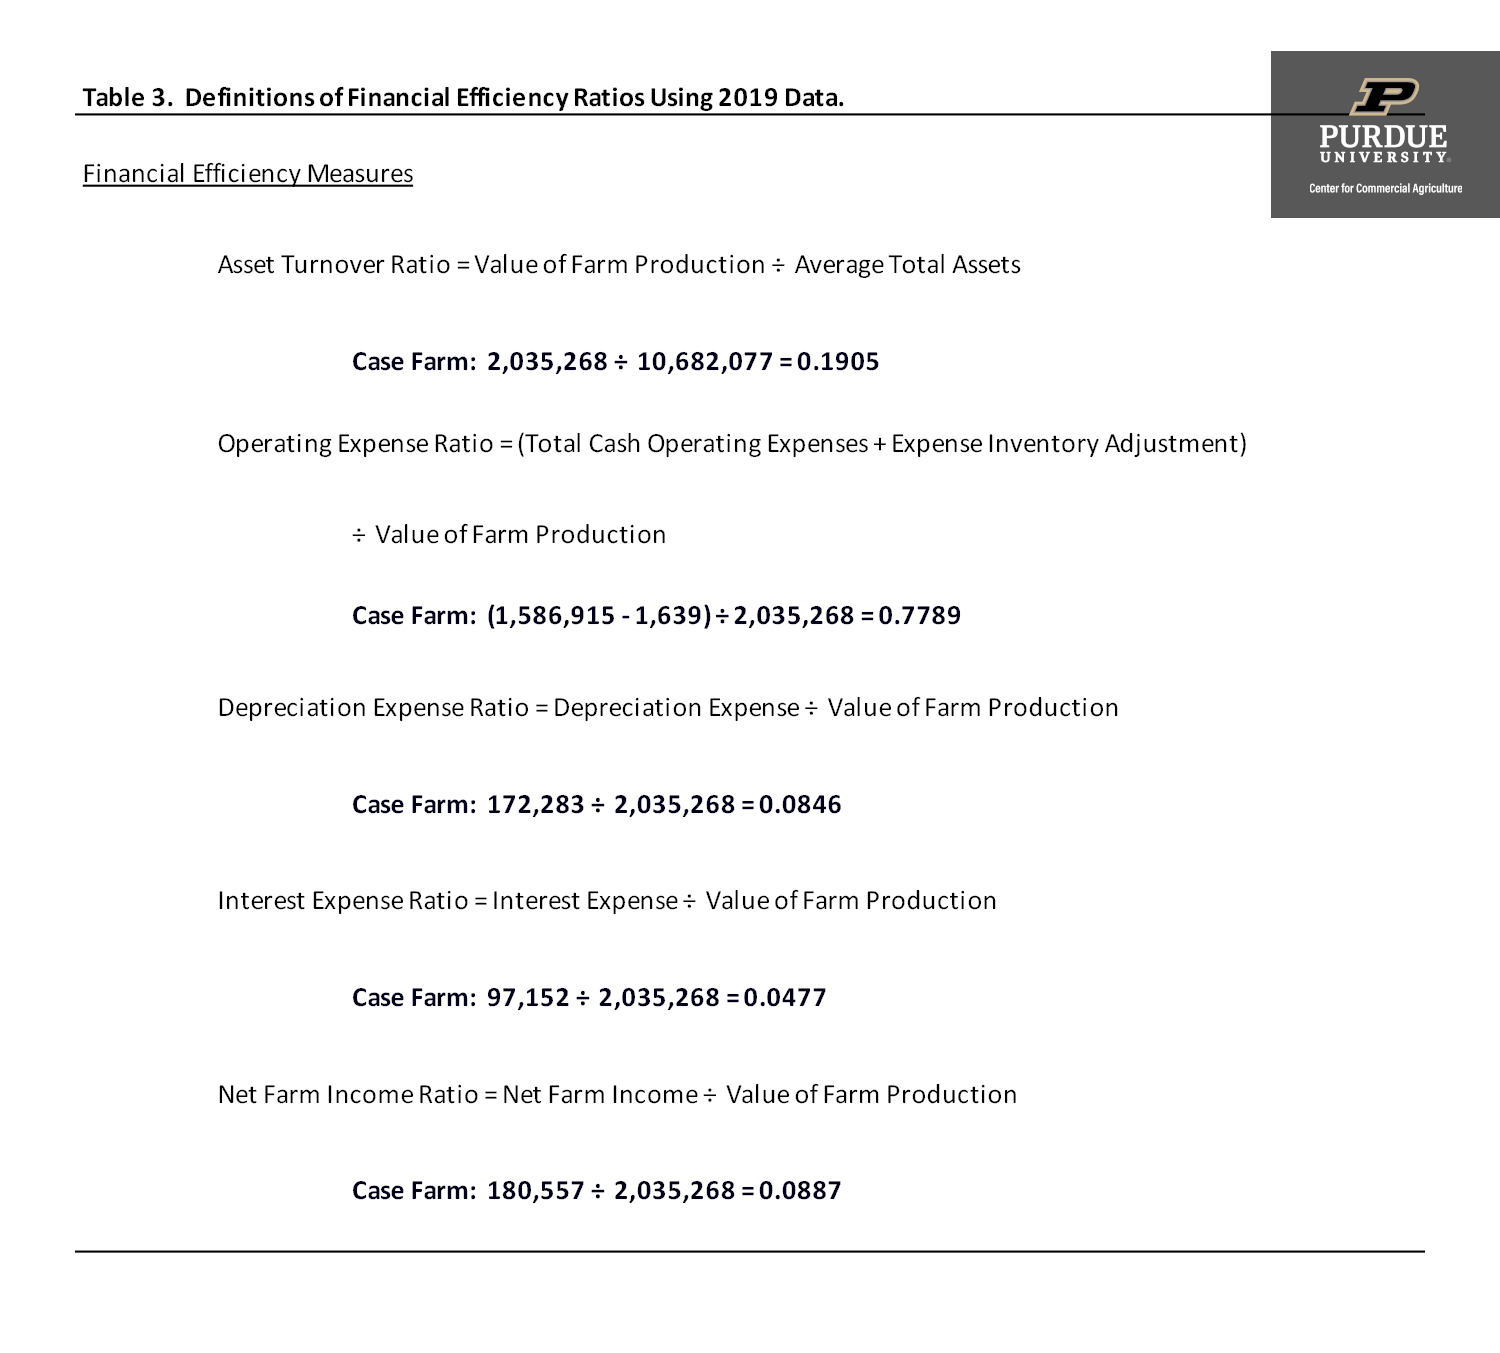
Table 3. Definitions of Financial Efficiency Ratios Using 2019 Data.
Financial efficiency ratios include the asset turnover ratio, the expense ratios, and the net farm income ratio. The “green” region for the asset turnover ratio is 35 percent. This ratio varies widely among farm types and land tenure. Livestock farms and farms with a relatively higher percent of owned land tend to have lower asset turnover ratios. The asset turnover ratio monitors how efficiently a farm is utilizing its asset base. If assets are utilized more efficiently, the farm will have a relatively high asset turnover ratio. The “green” regions for the other efficiency ratios are 55 percent for the operating expense ratio, 7.5 percent for depreciation and interest expense ratios, and 30 percent for the net farm income ratio. The summation of operating expense ratio, depreciation expense ratio, interest expense ratio, and net farm income ratio is 100 percent. So, if net farm income as a percent of value of farm production is relatively high for a particular farm, one or more of the expense ratios will be relatively low for this farm.
Many financial analysts focus on the relationship between the operating profit margin ratio, the asset turnover ratio, and the rate of return on farm assets. If we multiply the operating profit margin ratio by the asset turnover ratio, we obtain the rate of return on farm assets. This tells us that if we want to improve the rate of return on farm assets, we will need to increase profitability or earnings (i.e., the operating profit margin ratio), the efficiency with which we utilize assets or turns (i.e., the asset turnover ratio), or both of these measures.
Now let’s focus on the ratios for the case farm, starting with the profitability ratios. The operating profit margin, the rate of return on farm assets, and the rate of return on farm equity were in the “red” region of the financial scorecard in 2019 and in the “yellow” region for the latest ten-year period. For both columns in table 1, the rate of return on farm equity was lower than the rate of return on farm assets. It is also worth noting that the average ten-year profit margin for the case farm (0.142) was higher than the median ten-year ratio (0.128) for crop farms included in the FINBIN database. The top quartile had an average ratio of approximately 0.295, so the value for the case farm is well below the benchmark for the top quartile. The profit margin for the case farm in 2019 was slightly higher than the median for the crop farms included in the FINBIN database, which was 0.071.
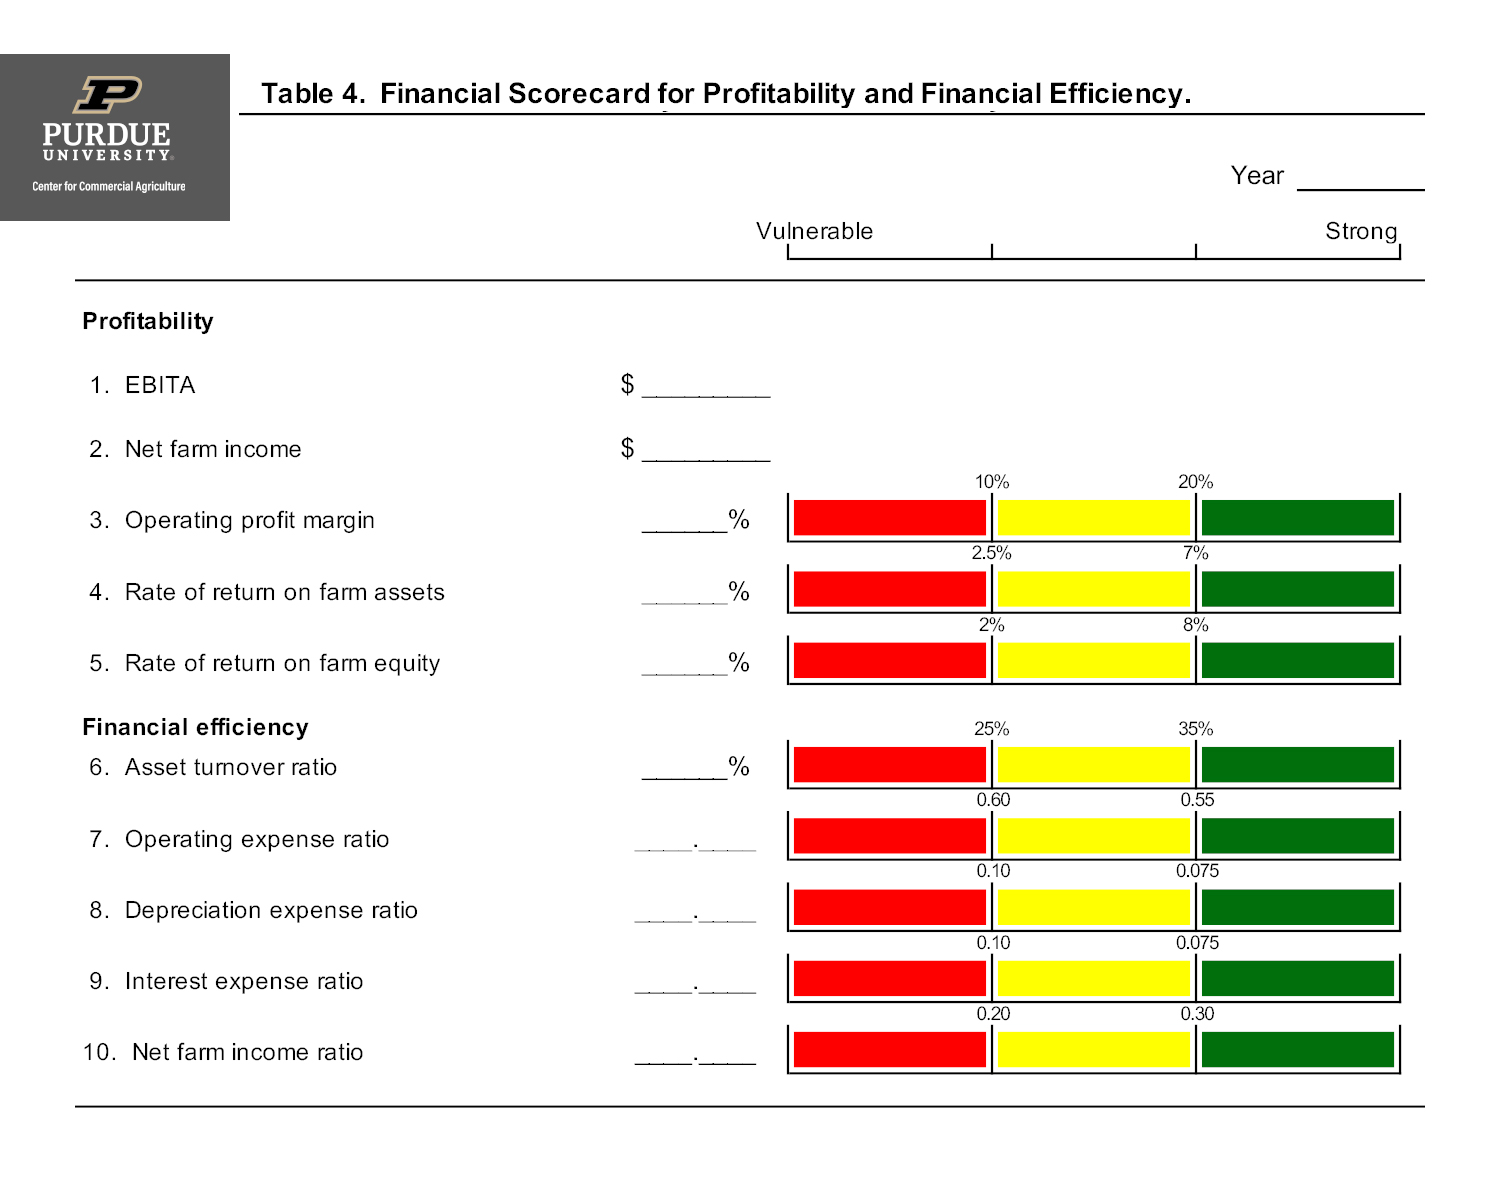
Table 4. Financial Scorecard for Profitability and Financial Efficiency.
The asset turnover ratio for the case farm was approximately 19.1 percent for 2019 and 21.1 percent for the latest ten-year period. In both instances, the ratio was in “red” region of the financial scorecard. The depreciation and interest expense ratios for the latest ten-year period were in the “green” regions of the scorecard, however, the operating expense ratio and the net farm income ratio were in the “red” region.
This article defined, described, and illustrated profitability and financial efficiency for a case farm. Ratios for the case farm were compared to financial scorecard values. The case farm compared unfavorably with respect to the benchmarks for several of the ratios. Often ratios identify problems, but do not pinpoint possible remedies to these problems. This is true for the case farm. In addition to examining ratios for the last several years, the case farm should compare specific cost items for the case farm to benchmarks for these cost items.
References
Langemeier, M. “Market Value Balance Sheet and Analysis.” Center for Commercial Agriculture, Purdue University, August 26, 2020.
Langemeier, M. “Components of an Accrual Farm Income Statement.” Center for Commercial Agriculture, Purdue University, August 26, 2020.
Langemeier, M. “Sources and Uses of Funds Statement.” Center for Commercial Agriculture, Purdue University, August 26, 2020.
University of Minnesota. FINBIN database, FINBIN | The Farm Financial Management Database, accessed September 25, 2020.
![]()
![]()
![]()
![]()
![]()
TEAM LINKS:

PART OF A SERIES:

RELATED RESOURCES
UPCOMING EVENTS
We are taking a short break, but please plan to join us at one of our future programs that is a little farther in the future.