September 23, 2020
Du Pont Financial Analysis
by Michael Langemeier
![]()
![]()
![]()
![]()
![]()
The Du Pont financial analysis model is a useful method of illustrating the relationship between the asset turnover ratio, the operating profit margin ratio, return on assets, and return on equity. In this article, a case farm in west central Indiana is used to examine the relationships between profitability and financial efficiency ratios, and to examine the impact of a change in revenue, variable costs, or owning rather than leasing 150 acres on financial performance.
Two previous articles illustrated the computation of the operating profit margin ratio and the asset turnover ratio (see here and here). The base case in Table 1 illustrates the projected profit margin and asset turnover ratio for the case farm in 2021. Trend yields and forecasted prices are used for the projections. As shown in Table 1, multiplying the operating profit margin for the base case (0.015) by the asset turnover ratio for the base case (0.170) yields a return on assets of 0.002 or 0.2 percent. The relationship between the asset turnover ratio, the operating profit margin ratio, and return on assets makes it very clear that increasing either the asset turnover ratio (“turns”) or the operating profit margin ratio (“earns”) leads to an increase in return on assets. To compute return on equity, in addition to return on assets, we need a solvency measure (assets to equity) and a measure called the “debt burden”. The debt burden is computed by dividing net farm income minus unpaid operator labor by net farm income minus unpaid operator labor plus interest expense. Return on equity is then computed by multiplying assets to equity by return on assets by the debt burden. This computation tells us that in addition to “turns” and “earns”, return on equity depends on the farm’s financial structure. Return on equity for the case farm is -0.007 or -0.7 percent. Whether return on equity is greater than or less than return on assets depends on how much profitability is being garnered through borrowing. If return on equity is greater than return on assets, borrowing is a profitability endeavor. If the situation is reversed (i.e., return on equity is less than return on assets), borrowing money does not pay. The projection for the base case suggests that the later situation is going to play out. Of course, it is not possible to know with certainty whether borrowing is going to pay in 2021 and beyond.
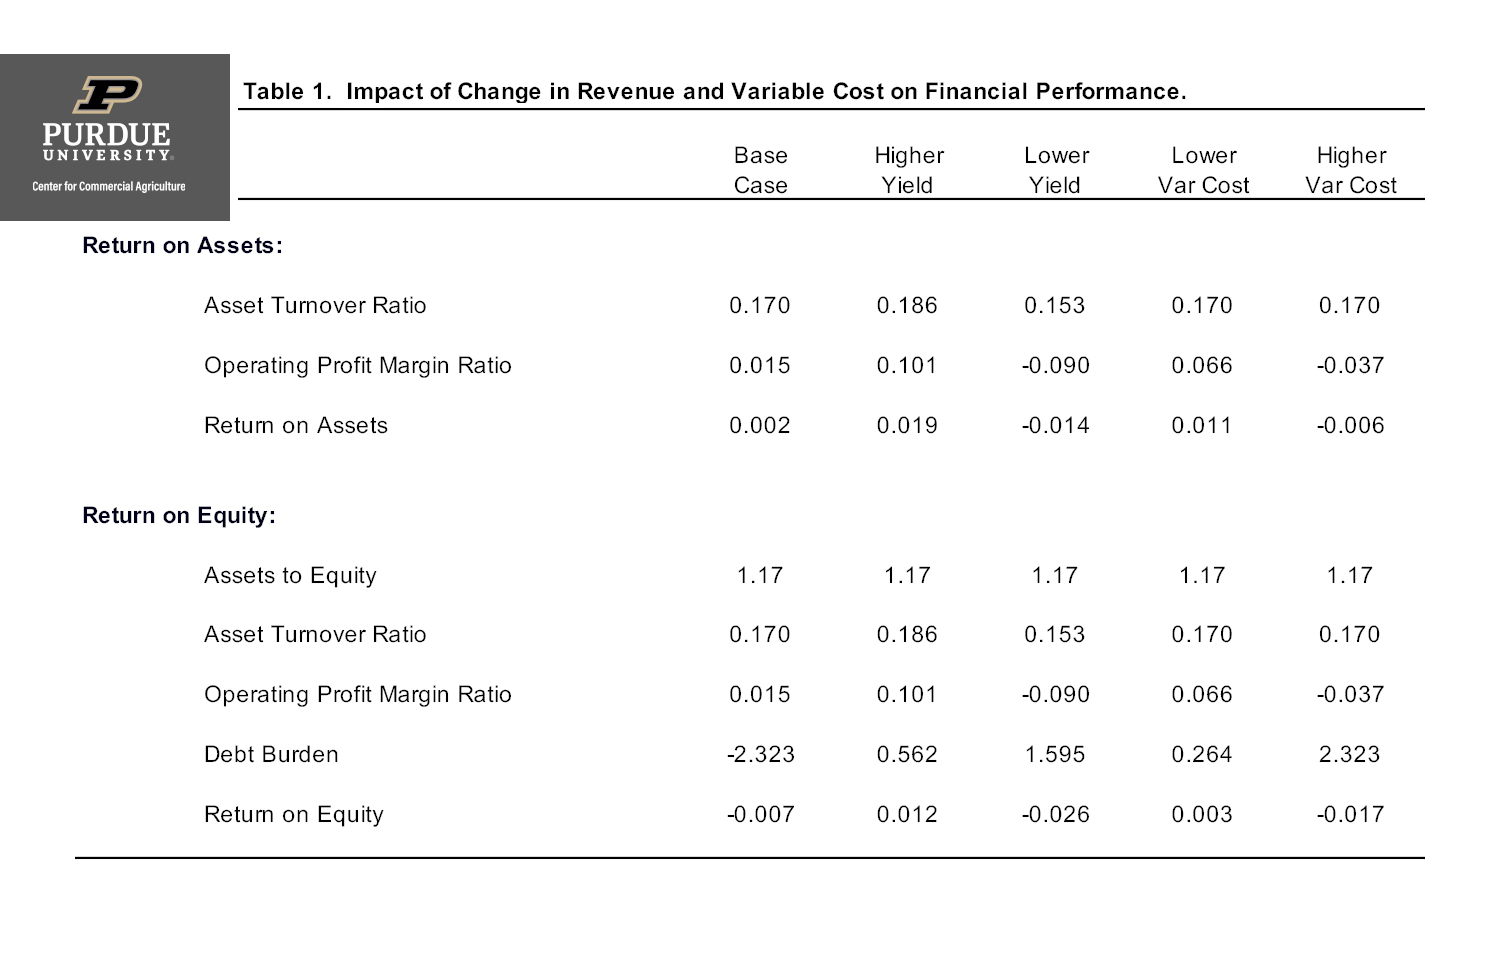
Table 1. Impact of Change in Revenue and Variable Cost on Financial Performance
In addition to illustrating the performance of the base case in 2021, Table 1 compares the base case with four scenarios: higher yield, lower yield, lower variable cost, and higher variable cost. The first two scenarios in Table 1 examine the impact of a change in value of farm production (i.e., a gross income measure) in the form of 10 percent higher or 10 percent lower yields on financial performance. It is important to note that a change in value of farm production impacts both the asset turnover ratio and the operating profit margin ratio. A 10 percent increase in trend yields (decrease in trend yields) causes the asset turnover ratio to increase (decrease) from 0.170 for the base case to 0.186 (0.153), and the operating profit margin ratio to increase (decrease) from 0.015 for the base case to 0.101 (-0.090). Return on assets and return on equity respond sharply to a change in yields. Note that return on equity is positive, though still smaller than return on assets, for the higher yield scenario. A 10 percent change in value of farm production is not large by historical standards. Value of farm production for the case farm declined by more than 10 percent in 2013 and increased by more than 10 percent in 2011.
The third and fourth scenarios in Table 1 examine the impact of a 10 percent change in variable cost on financial performance. For purposes of this article, variable cost exclude cash rent, labor cost, and depreciation. Because it does not change value of farm production, a change in variable cost does not impact the asset turnover ratio. A 10 percent decrease (increase) in variable cost causes the operating profit margin ratio to increase (decrease) from 0.015 for the base case to 0.066 (-0.037). Though the impact of changing variable cost is not as large as the impact of changing value of farm production, the resulting change in financial performance is still relatively large. Under the reduction in variable cost scenario, return on assets and return on equity both increased approximately 1 percent.
The results in Table 1 illustrate the importance of stress testing financial performance. Also, they reveal the importance of managing costs without having a detrimental impact on yields. The Du Pont financial analysis model can also be used to examine the impact of expansion or asset purchases on financial performance. As an example, Table 2 illustrates the impact on financial performance associated with purchasing 150 acres that are currently be cash rented by the farm. The land is purchased with a 35 percent cash down payment and by borrowing the remaining 65 percent. Purchasing 150 acres resulted in a lower asset turnover ratio and a higher operating profit margin ratio. Return on assets and return on equity were similar for the base case and land purchase scenarios. Though not discussed in this article, in addition to examining the impact on financial performance associated with a large asset purchase, it would also be important to examine the impact on liquidity and solvency. For example, working capital per acre would decline from $892 for the base case to $746 as a result of the land purchase.
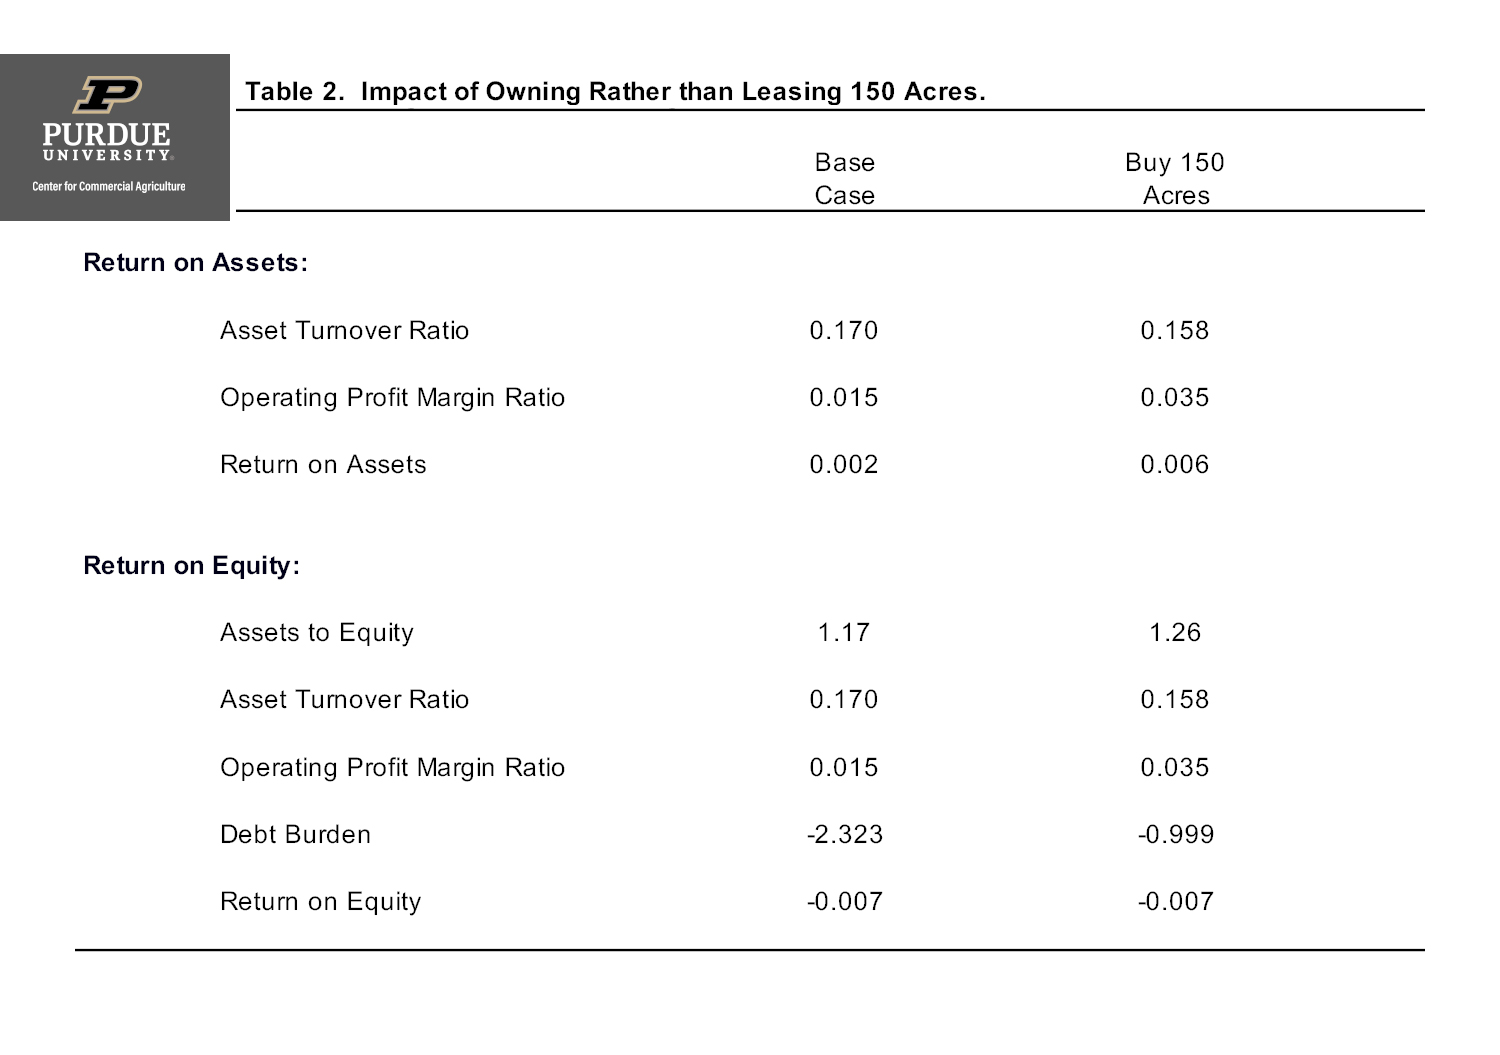
Table 2. Impact of Owning Rather than Leasing 150 Acres
This article examined the relationship between profitability and financial efficiency ratios, and the impact of changes in value of farm production, variable cost, or purchasing rather than leasing land on financial performance. A 10 percent change in value of farm production or variable cost had a large impact on financial performance. Even a small change in value of farm production or cost can have a significant impact on financial performance. Another illustration examined the impact of a change in land ownership. Purchasing 150 acres of land that was previously cash rented resulted in a decline in the asset turnover ratio and an increase in the operating profit margin ratio. Rates of return on assets and equity were similar between the base case and the case that examined the purchase of 150 acres. Given the sensitivity of financial performance to operational changes, it is important to examine the impact of these changes on profitability and financial efficiency. The Du Pont financial analysis model is useful when analyzing the impact of operational changes.
![]()
![]()
![]()
![]()
![]()
TEAM LINKS:

PART OF A SERIES:

RELATED RESOURCES
UPCOMING EVENTS
We are taking a short break, but please plan to join us at one of our future programs that is a little farther in the future.